Key findings:
Average annual tuition and fees across all U.S. colleges rose from $508 in 1963-64 to $14,688 in 2022-23, a 28x increase over six decades.
At 4-year institutions, tuition surged from $553 in 1963-64 to $17,709 in 2022-23, showing the steepest long-term growth.
2-year colleges increased from $171 in 1963-64 to $3,885 in 2022-23, a more moderate but still sharp rise.
Over the past 20 years, college tuition and fees grew by 144.72%, averaging +4.68% per year.
In the last 10 years alone, tuition rose by 37.5%, far outpacing inflation and wage growth.
Private 4-year colleges now cost on average $35,248 per year, compared with $9,750 at public 4-year institutions, underscoring a widening affordability gap.
Living arrangements significantly affect costs: students on campus face total expenses above $38,000 per year, while those living with family average $26,500 or less.
Inflation-adjusted data show college costs have more than doubled since the late 1960s, highlighting higher education as one of the fastest-rising expenses in the U.S.
The cost of higher education in the United States has become one of the most pressing financial concerns for students and families. Over the past few decades, tuition and fees have risen sharply, often outpacing inflation and wage growth. Today, the price of attending college can vary widely depending on the type of institution, the state of residence, and whether a student chooses a public or private university.
For many families, understanding college costs means more than just looking at the sticker price. Beyond tuition, expenses like housing, food, books, and fees create a financial burden that makes planning for higher education increasingly complex. Parents often wonder not only how much college will cost now, but also how much 4 years of college will cost in the future, a question made even more urgent as forecasts predict continued increases.
This article explores the current landscape of tuition and fees, the differences between public and private institutions, the most expensive and affordable states for higher education, as well as long-term forecasts. It also examines the key drivers behind rising tuition and offers insights into why college has gotten so expensive. By the end, readers will have a clearer understanding of where costs stand today, why they are climbing, and what future students may expect to pay.
How much is college tuition per year?
Average total cost of attendance in 4-year institutions, by year
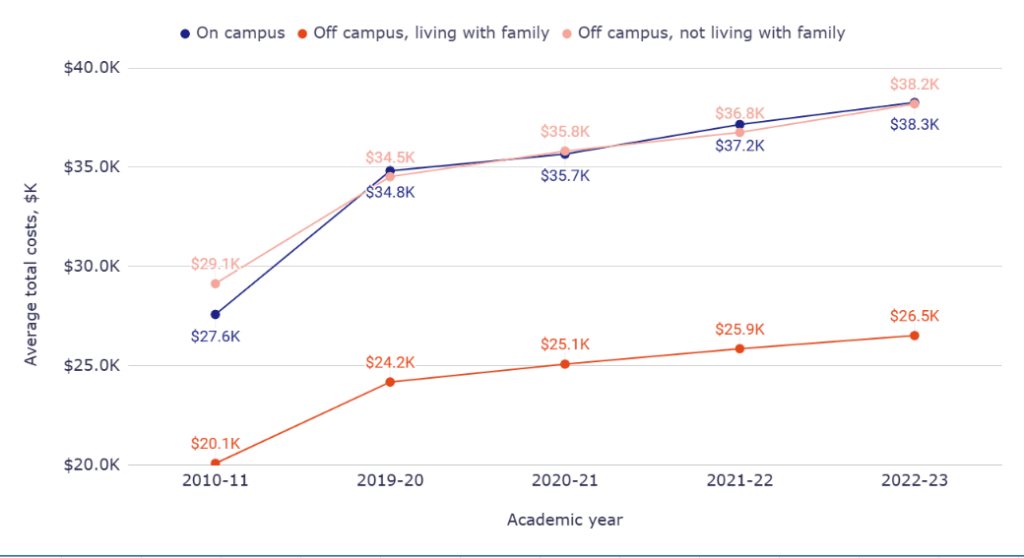
The chart below illustrates the average total cost for students at four-year institutions, broken down by living arrangement. The data spans from the 2010-11 academic year to 2022-23 and includes students living on campus, off campus with family, and off campus without family. This breakdown helps to understand how housing choices influence the overall financial burden of college.
- Students living on campus saw their average total cost rise from $27,589 in 2010-11 to $38,270 in 2022-23.
- Those living off campus with family experienced a smaller increase, from $20,084 in 2010-11 to $26,527 in 2022-23.
- Off-campus students not living with family faced costs growing from $29,142 in 2010-11 to $38,197 in 2022-23.
Average total cost, by living arrangement (all 4-year institutions)
| Academic year | On campus | Off campus, living with family | Off campus, not living with family |
| 2010-11 | $27,589 | $20,084 | $29,142 |
| 2019-20 | $34,830 | $24,186 | $34,534 |
| 2020-21 | $35,668 | $25,088 | $35,822 |
| 2021-22 | $37,162 | $25,862 | $36,760 |
| 2022-23 | $38,270 | $26,527 | $38,197 |
Overall, the data shows a clear upward trend in college costs across all living arrangements, with on-campus and off-campus without family expenses rising at a faster pace than living with family. This suggests that housing choices significantly affect the financial demands on students, highlighting the relative cost savings for those who can live with family while attending college.
After examining how living arrangements affect overall costs, it is also important to consider other essential components of student expenses, such as tuition and required materials.
Components of student costs (not including accommodation) in 4-year institutions in dynamics
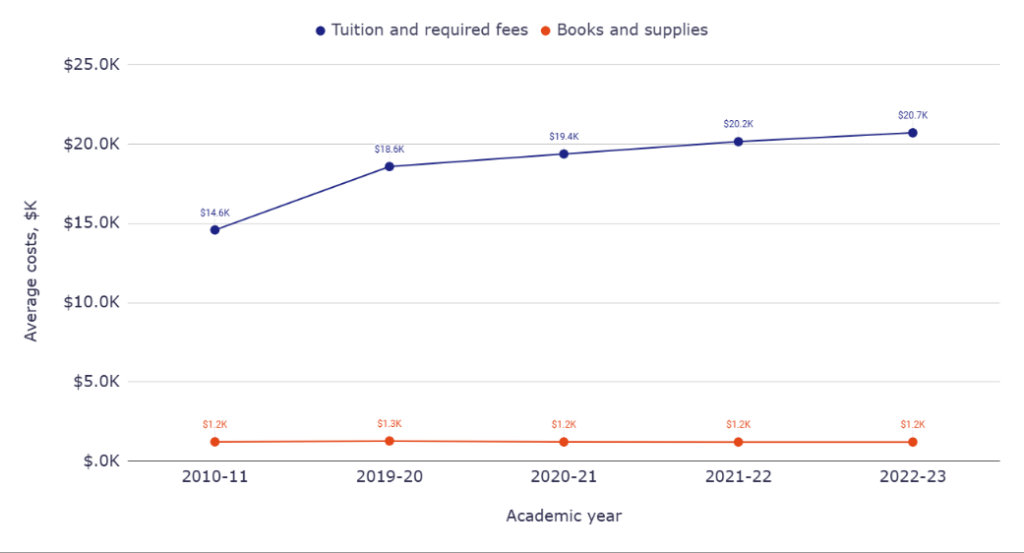
The chart below presents the average cost of tuition and required fees, along with books and supplies, for students at four-year institutions from the 2010-11 to the 2022-23 academic years. These figures exclude accommodation, providing a clearer view of the core academic expenses students face.
- Average tuition and required fees increased from $14,596 in 2010-11 to $20,727 in 2022-23.
- The cost of books and supplies remained relatively stable, rising slightly from $1,223 in 2010-11 to $1,212 in 2022-23.
- Most of the overall cost increase in this period is driven by tuition and required fees, rather than materials.
Academic expenses, all 4-year institutions in dynamics
| Academic year | Tuition and required fees | Books and supplies |
| 2010-11 | $14,596 | $1,223 |
| 2019-20 | $18,595 | $1,276 |
| 2020-21 | $19,391 | $1,216 |
| 2021-22 | $20,168 | $1,212 |
| 2022-23 | $20,727 | $1,212 |
The data highlights a consistent upward trend in tuition costs, while spending on books and supplies has remained nearly constant. This emphasizes that the majority of non-accommodation expenses are driven by tuition, indicating the growing financial pressure on students to cover educational fees.
Having explored housing costs at four-year institutions, it is useful to compare how living arrangements affect the total price at two-year colleges.
Average total cost of attendance in 2-year institutions, by year
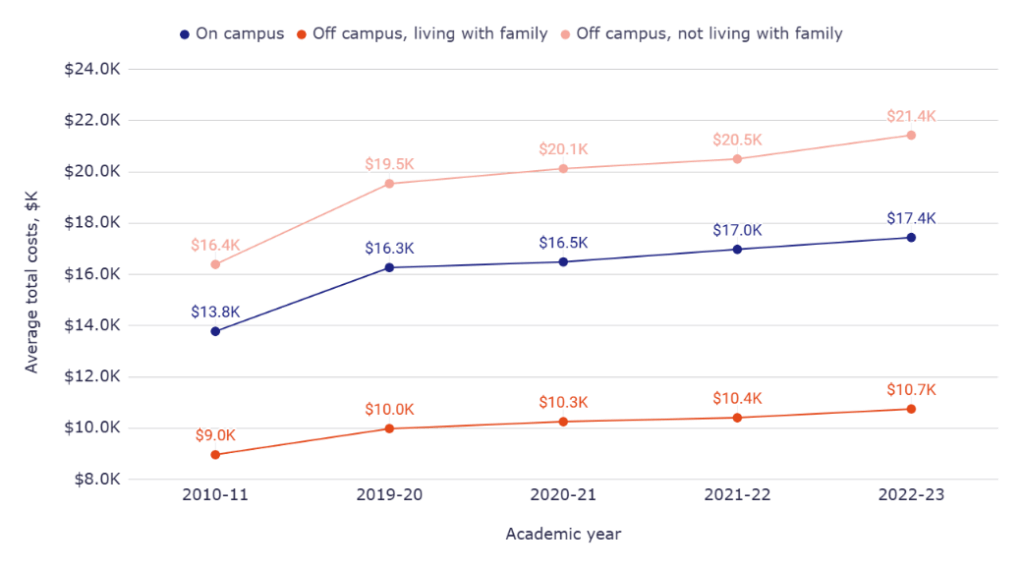
The chart below shows the average total cost for students at two-year institutions from the 2010-11 to the 2022-23 academic years, categorized by living arrangement. It includes students living on campus, off campus with family, and off campus without family. This comparison highlights differences in financial burdens between two-year and four-year colleges.
- Students living on campus experienced an increase in total cost from $13,777 in 2010-11 to $17,439 in 2022-23.
- Those living off campus with family saw costs rise from $8,964 in 2010-11 to $10,748 in 2022-23.
- Off-campus students not living with family faced growth in expenses from $16,389 in 2010-11 to $21,430 in 2022-23.
Average total cost, by living arrangement (all 2-year institutions)
| Academic year | On campus | Off campus, living with family | Off campus, not living with family |
| 2010-11 | $13,777 | $8,964 | $16,389 |
| 2019-20 | $16,265 | $9,983 | $19,542 |
| 2020-21 | $16,489 | $10,252 | $20,126 |
| 2021-22 | $16,976 | $10,406 | $20,503 |
| 2022-23 | $17,439 | $10,748 | $21,430 |
Overall, the data indicate that total costs at two-year institutions have steadily increased across all living arrangements, though the increase is smaller than at four-year colleges. Students living off campus with family continue to benefit from the lowest expenses, highlighting the cost-saving potential of family-supported housing.
Beyond housing costs, it is important to examine the core academic expenses at two-year institutions, including tuition and materials.
Components of student costs (not including accommodation) in 2-year institutions in the dynamics
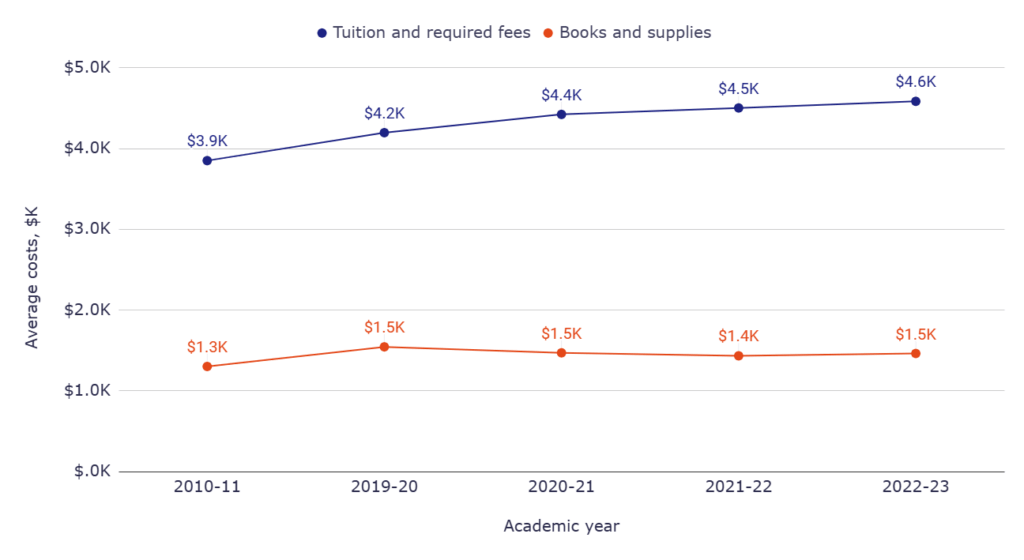
The chart below illustrates average student costs at two-year colleges from the 2010-11 to 2022-23 academic years, focusing on tuition and required fees as well as books and supplies. These figures exclude accommodation, providing insight into the essential academic costs students face.
- Tuition and required fees increased from $3,850 in 2010-11 to $4,584 in 2022-23.
- Costs for books and supplies rose modestly from $1,302 in 2010-11 to $1,463 in 2022-23.
- The primary driver of non-accommodation cost growth is tuition, while materials costs remained relatively stable.
Component of student costs (not including accommodation, all 2-year institutions)
| Academic year | Tuition and required fees | Books and supplies |
| 2010-11 | $3,850 | $1,302 |
| 2019-20 | $4,196 | $1,545 |
| 2020-21 | $4,422 | $1,471 |
| 2021-22 | $4,502 | $1,434 |
| 2022-23 | $4,584 | $1,463 |
The data shows a steady increase in tuition over the years, whereas spending on books and supplies has fluctuated only slightly. This pattern highlights that the financial pressure on two-year college students is largely influenced by tuition, emphasizing the importance of monitoring and planning for rising educational fees.
After reviewing cost trends by living arrangement at individual institution types, it is valuable to compare average costs across both living arrangements and institution categories.
Student costs breakdown
Average college costs by living arrangement and institution type
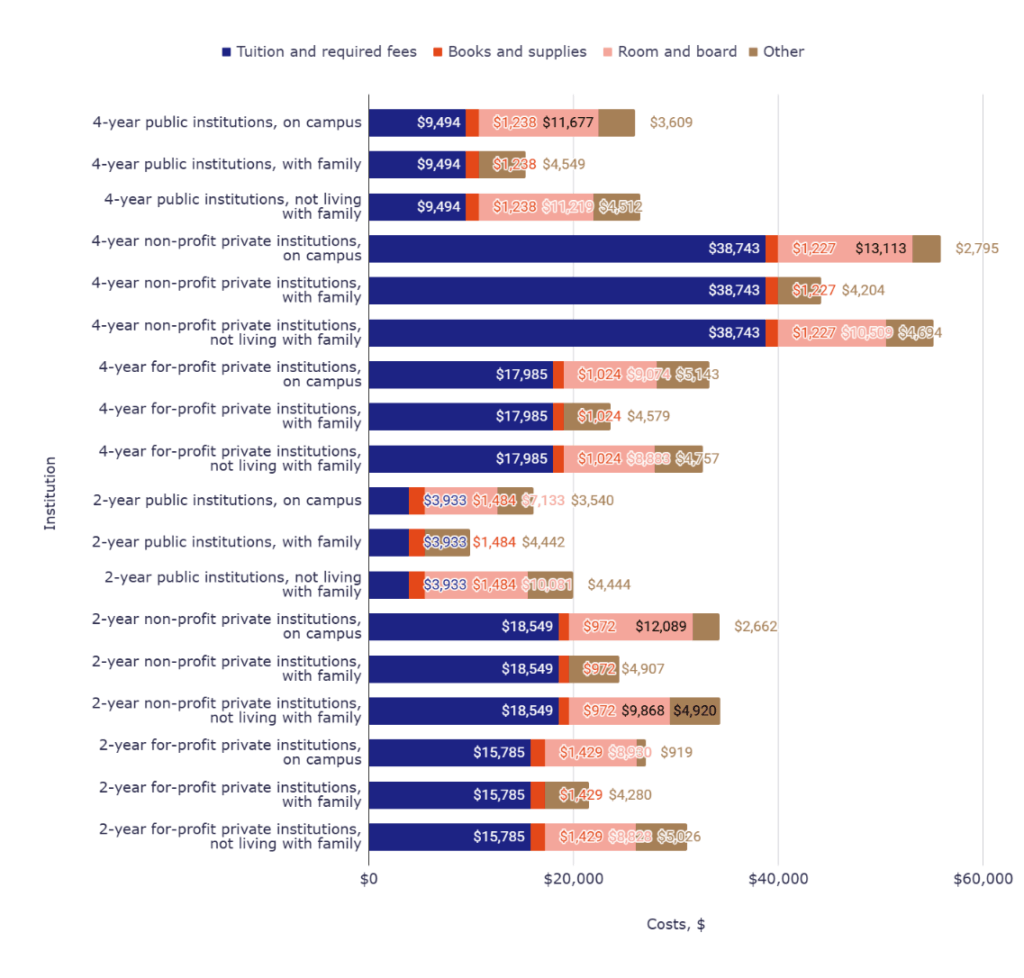
The chart below presents a detailed breakdown of average college costs from 2019 to 2023, combining tuition and required fees, books and supplies, room and board, and other expenses. Data is categorized by institution type (public, private non-profit, and private for-profit) and by living arrangement: on campus, off campus with family, and off campus without family. This overview allows for a clear comparison of financial burdens across different student scenarios.
- At 4-year public institutions, on-campus students face total average costs of $26,018, while those living with family spend $15,281.
- Students attending 4-year non-profit private institutions on campus incur the highest total cost at $55,878, compared with $44,174 for students living with family.
- Among 2-year public institutions, off-campus students not living with family pay $19,941 on average, nearly $10,000 more than students living with family ($9,859).
Average college costs by living arrangement and institution type (2019-2023)
| Institutions / Costs | Tuition and required fees | Books and supplies | Room and board | Other |
| 4-year public institutions, on campus | $9,494 | $1,238 | $11,677 | $3,609 |
| 4-year public institutions, with family | $9,494 | $1,238 | x | $4,549 |
| 4-year public institutions, not living with family | $9,494 | $1,238 | $11,219 | $4,512 |
| 4-year non-profit private institutions, on campus | $38,743 | $1,227 | $13,113 | $2,795 |
| 4-year non-profit private institutions, with family | $38,743 | $1,227 | x | $4,204 |
| 4-year non-profit private institutions, not living with family | $38,743 | $1,227 | $10,509 | $4,694 |
| 4-year for-profit private institutions, on campus | $17,985 | $1,024 | $9,074 | $5,143 |
| 4-year for-profit private institutions, with family | $17,985 | $1,024 | x | $4,579 |
| 4-year for-profit private institutions, not living with family | $17,985 | $1,024 | $8,883 | $4,757 |
| 2-year public institutions, on campus | $3,933 | $1,484 | $7,133 | $3,540 |
| 2-year public institutions, with family | $3,933 | $1,484 | x | $4,442 |
| 2-year public institutions, not living with family | $3,933 | $1,484 | $10,081 | $4,444 |
| 2-year non-profit private institutions, on campus | $18,549 | $972 | $12,089 | $2,662 |
| 2-year non-profit private institutions, with family | $18,549 | $972 | x | $4,907 |
| 2-year non-profit private institutions, not living with family | $18,549 | $972 | $9,868 | $4,920 |
| 2-year for-profit private institutions, on campus | $15,785 | $1,429 | $8,930 | $919 |
| 2-year for-profit private institutions, with family | $15,785 | $1,429 | x | $4,280 |
| 2-year for-profit private institutions, not living with family | $15,785 | $1,429 | $8,828 | $5,026 |
The data show that both institution type and housing arrangement strongly influence total college costs. Private non-profit institutions consistently have higher tuition and fees, and living on campus substantially increases total expenses. Students living with family benefit from significant cost reductions across all institution types, highlighting the impact of housing choices on overall affordability.
Following our review of costs by institution type and living arrangement, it is essential to examine overall tuition and fee increases over the last several decades to understand how college expenses have evolved.
Tuition and fees increase dynamically
Tuition and required fees by year (all institutions)
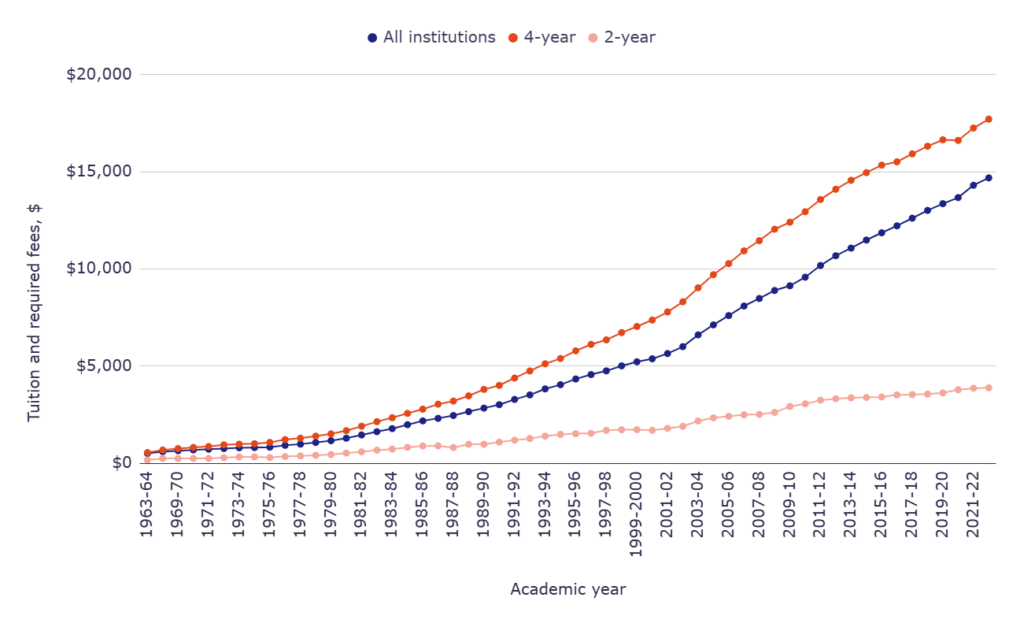
The chart below shows tuition and required fees for all institutions, including 4-year and 2-year colleges, from 1963-64 through 2022-23. Analyzing this data provides a clear perspective on the cost of college over time, helping students and families understand long-term trends in higher education expenses. It also answers questions like how much college tuition is per year and the average college tuition per semester.
- Tuition at all institutions increased from $508 in 1963-64 to $14,688 in 2022-23, reflecting a significant tuition increase over time.
- For 4-year institutions, average tuition rose from $553 in 1963-64 to $17,709 in 2022-23, showing the largest growth compared with 2-year colleges.
- 2-year colleges saw tuition increase from $171 in 1963-64 to $3,885 in 2022-23, indicating steady but lower growth relative to 4-year institutions.
Tuition and required fees by year
| Academic year | All institutions | 4-year | 2-year |
| 1963-64 | $508 | $553 | $171 |
| 1968-69 | $596 | $683 | $250 |
| 1969-70 | $645 | $755 | $247 |
| 1970-71 | $688 | $814 | $249 |
| 1971-72 | $724 | $865 | $251 |
| 1972-73 | $759 | $950 | $287 |
| 1973-74 | $796 | $985 | $328 |
| 1974-75 | $809 | $1,008 | $328 |
| 1975-76 | $829 | $1,073 | $297 |
| 1976-77 | $924 | $1,218 | $346 |
| 1977-78 | $984 | $1,291 | $378 |
| 1978-79 | $1,073 | $1,397 | $411 |
| 1979-80 | $1,163 | $1,513 | $451 |
| 1980-81 | $1,289 | $1,679 | $526 |
| 1981-82 | $1,457 | $1,907 | $590 |
| 1982-83 | $1,626 | $2,139 | $675 |
| 1983-84 | $1,783 | $2,344 | $730 |
| 1984-85 | $1,985 | $2,567 | $821 |
| 1985-86 | $2,181 | $2,784 | $888 |
| 1986-87 | $2,312 | $3,042 | $897 |
| 1987-88 | $2,458 | $3,201 | $809 |
| 1988-89 | $2,658 | $3,472 | $979 |
| 1989-90 | $2,839 | $3,800 | $978 |
| 1990-91 | $3,016 | $4,009 | $1,087 |
| 1991-92 | $3,286 | $4,385 | $1,189 |
| 1992-93 | $3,517 | $4,752 | $1,276 |
| 1993-94 | $3,827 | $5,119 | $1,399 |
| 1994-95 | $4,044 | $5,391 | $1,488 |
| 1995-96 | $4,338 | $5,786 | $1,522 |
| 1996-97 | $4,564 | $6,118 | $1,543 |
| 1997-98 | $4,755 | $6,351 | $1,695 |
| 1998-99 | $5,013 | $6,723 | $1,725 |
| 1999-2000 | $5,222 | $7,040 | $1,728 |
| 2000-01 | $5,377 | $7,372 | $1,698 |
| 2001-02 | $5,646 | $7,786 | $1,800 |
| 2002-03 | $6,002 | $8,309 | $1,903 |
| 2003-04 | $6,608 | $9,029 | $2,174 |
| 2004-05 | $7,122 | $9,706 | $2,338 |
| 2005-06 | $7,601 | $10,279 | $2,417 |
| 2006-07 | $8,093 | $10,931 | $2,496 |
| 2007-08 | $8,480 | $11,455 | $2,516 |
| 2008-09 | $8,892 | $12,046 | $2,617 |
| 2009-10 | $9,135 | $12,404 | $2,923 |
| 2010-11 | $9,575 | $12,945 | $3,060 |
| 2011-12 | $10,179 | $13,572 | $3,244 |
| 2012-13 | $10,681 | $14,099 | $3,322 |
| 2013-14 | $11,073 | $14,563 | $3,369 |
| 2014-15 | $11,487 | $14,957 | $3,389 |
| 2015-16 | $11,862 | $15,343 | $3,412 |
| 2016-17 | $12,219 | $15,512 | $3,519 |
| 2017-18 | $12,613 | $15,923 | $3,537 |
| 2018-19 | $13,012 | $16,316 | $3,563 |
| 2019-20 | $13,360 | $16,646 | $3,622 |
| 2020-21 | $13,674 | $16,614 | $3,782 |
| 2021-22 | $14,306 | $17,252 | $3,860 |
| 2022-23 | $14,688 | $17,709 | $3,885 |
Overall, the data illustrate a consistent upward trend in tuition costs across all institution types, highlighting the growing financial burden of higher education. This pattern underscores the importance of planning, as the average increase in college tuition per year has outpaced general inflation. Observers can see clearly how much college tuition has increased in the last 10 years, emphasizing that rising costs are a key consideration for prospective students and their families.
To better understand the financial trajectory of higher education, it is informative to examine the year-over-year changes in tuition and required fees at both 2-year and 4-year institutions.
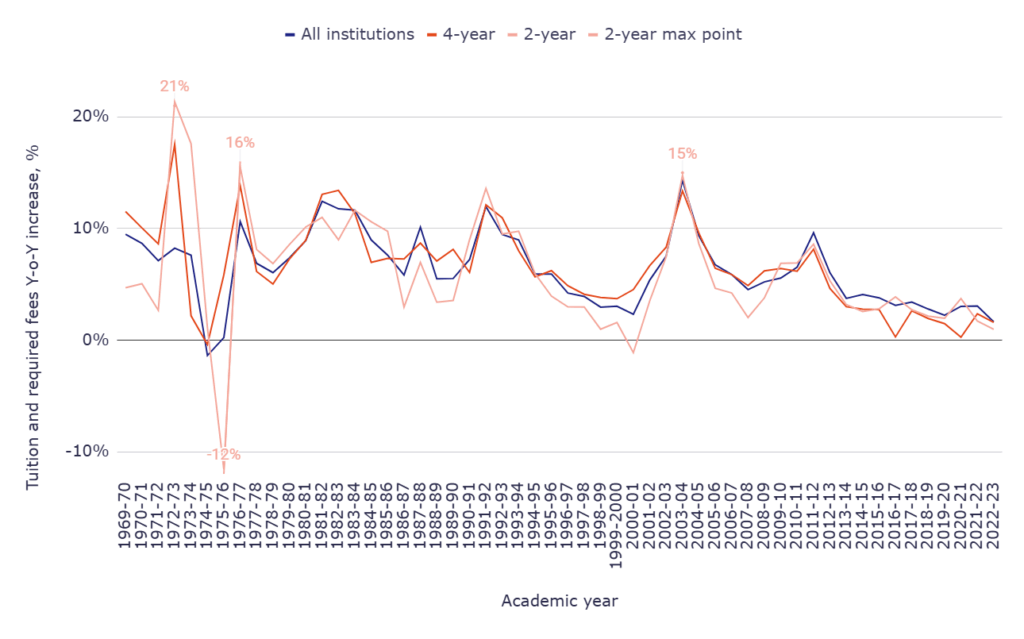
Tuition and required fees Y-o-Y increase (all institutions)
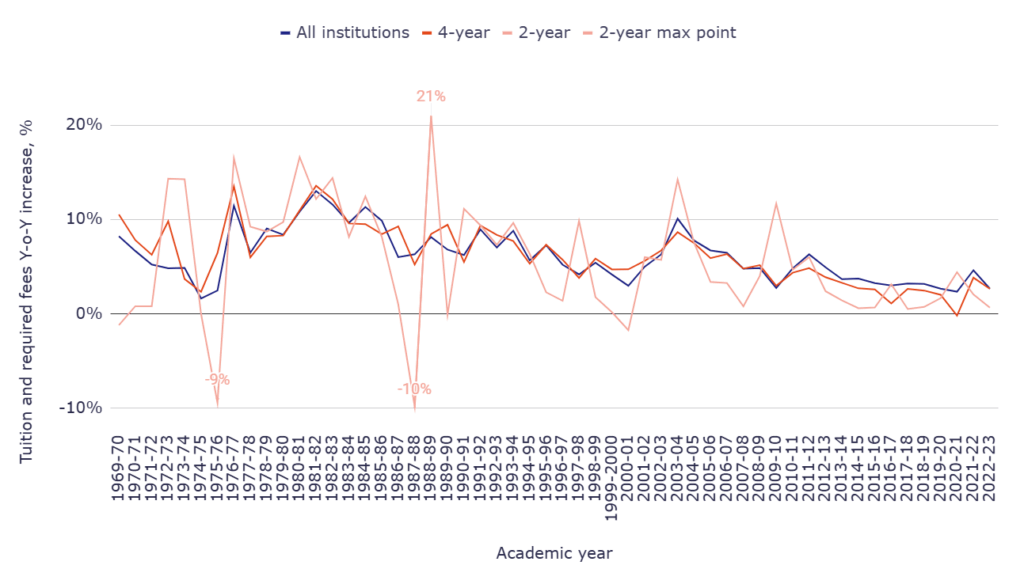
The chart below presents the annual percentage increase in tuition and required fees from 1969-70 to 2022-23 for all institutions, including separate data for 4-year and 2-year colleges. This analysis provides insight into tuition costs over time and demonstrates how much college tuition has increased in the last 10 years. It also helps students and families estimate how much college tuition is per year and the average college tuition per semester over different periods.
- College tuition and fees averaged an annual increase over the past 20 years: 4.68%.
- Increase in college tuition and fees over the past 20 years: 144.72%.
How much has college tuition increased in the last 10 years?
- Increase in college tuition and fees over the past 10 years: 37.52%.
Y-o-Y increase in tuition and required fees
| Academic year | All institutions | 4-year | 2-year |
| 1969-70 | 8.22% | 10.54% | -1.20% |
| 1970-71 | 6.67% | 7.81% | 0.81% |
| 1971-72 | 5.23% | 6.27% | 0.80% |
| 1972-73 | 4.83% | 9.83% | 14.34% |
| 1973-74 | 4.87% | 3.68% | 14.29% |
| 1974-75 | 1.63% | 2.34% | 0.00% |
| 1975-76 | 2.47% | 6.45% | -9.45% |
| 1976-77 | 11.46% | 13.51% | 16.50% |
| 1977-78 | 6.49% | 5.99% | 9.25% |
| 1978-79 | 9.04% | 8.21% | 8.73% |
| 1979-80 | 8.39% | 8.30% | 9.73% |
| 1980-81 | 10.83% | 10.97% | 16.63% |
| 1981-82 | 13.03% | 13.58% | 12.17% |
| 1982-83 | 11.60% | 12.17% | 14.41% |
| 1983-84 | 9.66% | 9.58% | 8.15% |
| 1984-85 | 11.33% | 9.51% | 12.47% |
| 1985-86 | 9.87% | 8.45% | 8.16% |
| 1986-87 | 6.01% | 9.27% | 1.01% |
| 1987-88 | 6.31% | 5.23% | -9.81% |
| 1988-89 | 8.14% | 8.47% | 21.01% |
| 1989-90 | 6.81% | 9.45% | -0.10% |
| 1990-91 | 6.23% | 5.50% | 11.15% |
| 1991-92 | 8.95% | 9.38% | 9.38% |
| 1992-93 | 7.03% | 8.37% | 7.32% |
| 1993-94 | 8.81% | 7.72% | 9.64% |
| 1994-95 | 5.67% | 5.31% | 6.36% |
| 1995-96 | 7.27% | 7.33% | 2.28% |
| 1996-97 | 5.21% | 5.74% | 1.38% |
| 1997-98 | 4.18% | 3.81% | 9.85% |
| 1998-99 | 5.43% | 5.86% | 1.77% |
| 1999-2000 | 4.17% | 4.72% | 0.17% |
| 2000-01 | 2.97% | 4.72% | -1.74% |
| 2001-02 | 5.00% | 5.62% | 6.01% |
| 2002-03 | 6.31% | 6.72% | 5.72% |
| 2003-04 | 10.10% | 8.67% | 14.24% |
| 2004-05 | 7.78% | 7.50% | 7.54% |
| 2005-06 | 6.73% | 5.90% | 3.38% |
| 2006-07 | 6.47% | 6.34% | 3.27% |
| 2007-08 | 4.78% | 4.79% | 0.80% |
| 2008-09 | 4.86% | 5.16% | 4.01% |
| 2009-10 | 2.73% | 2.97% | 11.69% |
| 2010-11 | 4.82% | 4.36% | 4.69% |
| 2011-12 | 6.31% | 4.84% | 6.01% |
| 2012-13 | 4.93% | 3.88% | 2.40% |
| 2013-14 | 3.67% | 3.29% | 1.41% |
| 2014-15 | 3.74% | 2.71% | 0.59% |
| 2015-16 | 3.26% | 2.58% | 0.68% |
| 2016-17 | 3.01% | 1.10% | 3.14% |
| 2017-18 | 3.22% | 2.65% | 0.51% |
| 2018-19 | 3.16% | 2.47% | 0.74% |
| 2019-20 | 2.67% | 2.02% | 1.66% |
| 2020-21 | 2.35% | -0.19% | 4.42% |
| 2021-22 | 4.62% | 3.84% | 2.06% |
| 2022-23 | 2.67% | 2.65% | 0.65% |
The data indicate that tuition increases have fluctuated considerably over the past 50 years, with periods of sharp growth followed by stabilization. While the pace of increase has slowed in recent years, the consistent upward trend highlights the rising cost of higher education. This information is crucial for students and families planning budgets and evaluating the cost of college over time, as understanding tuition increases over time provides context for long-term financial planning.
Building on overall tuition trends, it is important to analyze the trajectory of costs specifically at public institutions, where funding changes and in-state policies have shaped the affordability of higher education.
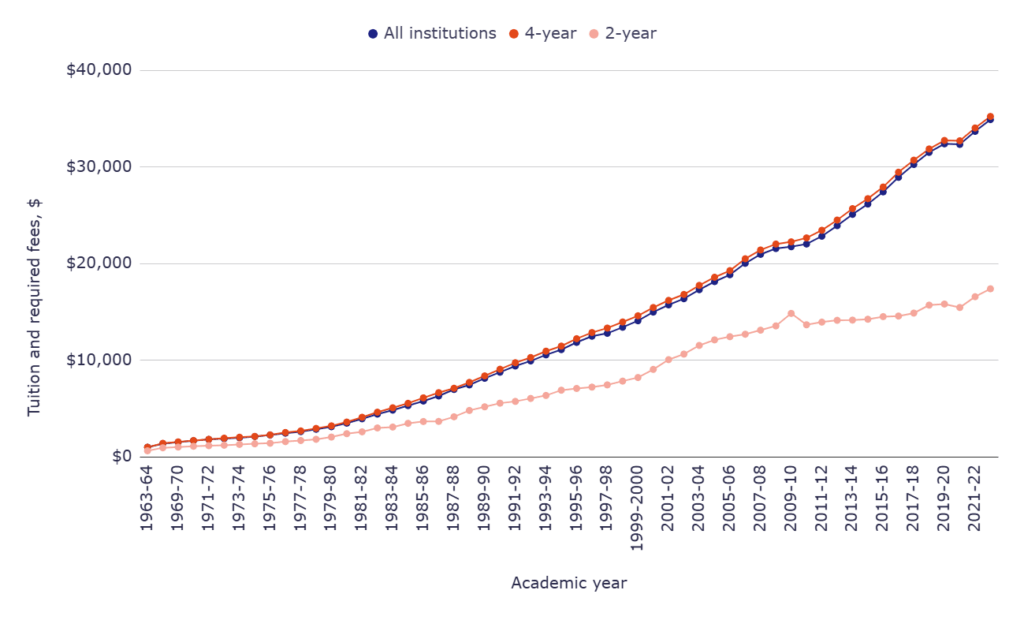
Tuition and required fees by year (public institutions)
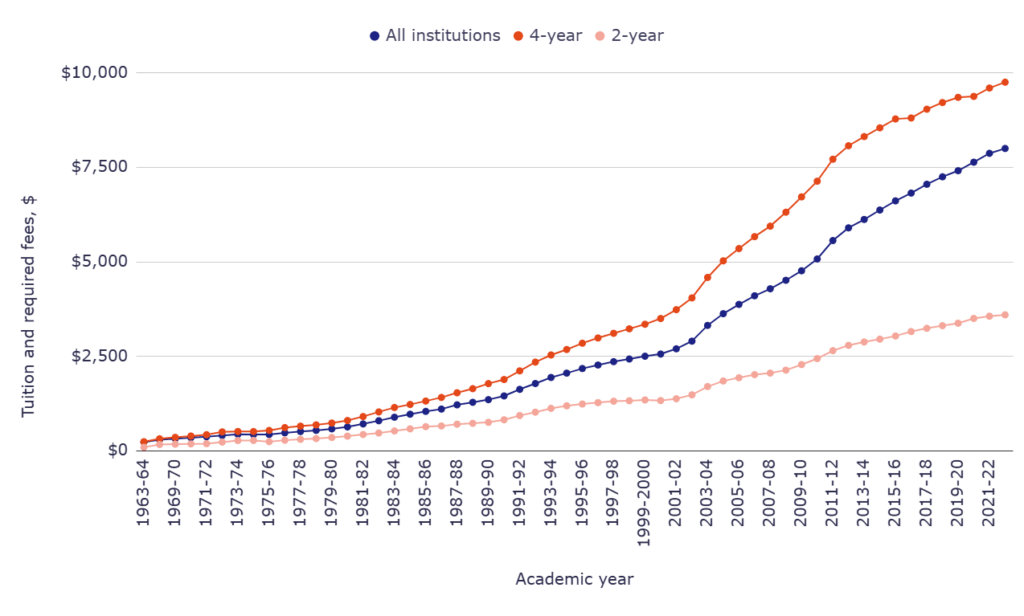
The chart below presents tuition and required fees at public colleges from 1963-64 through 2022-23, broken down by all institutions, 4-year, and 2-year colleges. Examining this data provides insight into the average increase in college tuition per year.
- Average tuition at 4-year public institutions increased from $243 in 1963-64 to $9,750 in 2022-23.
- Tuition at 2-year public colleges rose from $97 in 1963-64 to $3,598 in 2022-23.
- Across all public institutions, average tuition and fees grew from $234 in 1963-64 to $7,998 in 2022-23.
Tuition and required fees in public institutions by year
| Academic year | All institutions | 4-year | 2-year |
| 1963-64 | $234 | $243 | $97 |
| 1968-69 | $295 | $321 | $170 |
| 1969-70 | $323 | $358 | $178 |
| 1970-71 | $351 | $394 | $187 |
| 1971-72 | $376 | $428 | $192 |
| 1972-73 | $407 | $503 | $233 |
| 1973-74 | $438 | $514 | $274 |
| 1974-75 | $432 | $512 | $277 |
| 1975-76 | $433 | $542 | $245 |
| 1976-77 | $479 | $617 | $283 |
| 1977-78 | $512 | $655 | $306 |
| 1978-79 | $543 | $688 | $327 |
| 1979-80 | $583 | $738 | $355 |
| 1980-81 | $635 | $804 | $391 |
| 1981-82 | $714 | $909 | $434 |
| 1982-83 | $798 | $1,031 | $473 |
| 1983-84 | $891 | $1,148 | $528 |
| 1984-85 | $971 | $1,228 | $584 |
| 1985-86 | $1,045 | $1,318 | $641 |
| 1986-87 | $1,106 | $1,414 | $660 |
| 1987-88 | $1,218 | $1,537 | $706 |
| 1988-89 | $1,285 | $1,646 | $730 |
| 1989-90 | $1,356 | $1,780 | $756 |
| 1990-91 | $1,454 | $1,888 | $824 |
| 1991-92 | $1,628 | $2,117 | $936 |
| 1992-93 | $1,782 | $2,349 | $1,025 |
| 1993-94 | $1,942 | $2,537 | $1,125 |
| 1994-95 | $2,057 | $2,681 | $1,192 |
| 1995-96 | $2,179 | $2,848 | $1,239 |
| 1996-97 | $2,271 | $2,987 | $1,276 |
| 1997-98 | $2,360 | $3,110 | $1,314 |
| 1998-99 | $2,430 | $3,229 | $1,327 |
| 1999-2000 | $2,504 | $3,349 | $1,348 |
| 2000-01 | $2,562 | $3,501 | $1,333 |
| 2001-02 | $2,700 | $3,735 | $1,380 |
| 2002-03 | $2,903 | $4,046 | $1,483 |
| 2003-04 | $3,319 | $4,587 | $1,702 |
| 2004-05 | $3,629 | $5,027 | $1,849 |
| 2005-06 | $3,874 | $5,351 | $1,935 |
| 2006-07 | $4,102 | $5,666 | $2,017 |
| 2007-08 | $4,288 | $5,943 | $2,058 |
| 2008-09 | $4,512 | $6,312 | $2,136 |
| 2009-10 | $4,763 | $6,717 | $2,283 |
| 2010-11 | $5,075 | $7,132 | $2,441 |
| 2011-12 | $5,563 | $7,713 | $2,651 |
| 2012-13 | $5,899 | $8,070 | $2,792 |
| 2013-14 | $6,120 | $8,312 | $2,881 |
| 2014-15 | $6,370 | $8,543 | $2,955 |
| 2015-16 | $6,612 | $8,778 | $3,038 |
| 2016-17 | $6,818 | $8,804 | $3,156 |
| 2017-18 | $7,051 | $9,036 | $3,242 |
| 2018-19 | $7,248 | $9,212 | $3,312 |
| 2019-20 | $7,410 | $9,349 | $3,377 |
| 2020-21 | $7,635 | $9,374 | $3,503 |
| 2021-22 | $7,869 | $9,596 | $3,563 |
| 2022-23 | $7,998 | $9,750 | $3,598 |
The data shows a steady upward trend in tuition costs at public colleges, with 4-year institutions experiencing the most pronounced increases. Over the last 20 years, the average increase in college tuition per year highlights the rising financial demands on students attending public universities. This trend also reflects shifts in public college funding since the 1970s, underscoring the growing importance of financial planning for prospective students.
To further understand financial trends, examining the year-over-year increase in tuition and required fees at public institutions provides insight into the pace of change in higher education costs.
Tuition and required fees Y-o-Y increase (public institutions)
The chart below illustrates the annual percentage increase in tuition and required fees at public colleges from 1969-70 through 2022-23, including 4-year and 2-year institutions. This data highlights patterns in the average increase in college tuition per year.
- College tuition and fees averaged an annual increase over the past 20 years: 5.35%.
- Increase in 4-year public college tuition and fees over the past 20 years: 140.98%.
- Increase in 4-year public college tuition and fees over the past 10 years: 20.82%.
- Increase in 2-year public college tuition and fees over the past 20 years: 142.62%.
- Increase in 2-year public college tuition and fees over the past 10 years: 28.87%.
Y-o-Y increase in tuition and required fees in public institutions
| Academic year | All institutions | 4-year | 2-year |
| 1969-70 | 9.49% | 11.53% | 4.71% |
| 1970-71 | 8.67% | 10.06% | 5.06% |
| 1971-72 | 7.12% | 8.63% | 2.67% |
| 1972-73 | 8.24% | 17.52% | 21.35% |
| 1973-74 | 7.62% | 2.19% | 17.60% |
| 1974-75 | -1.37% | -0.39% | 1.09% |
| 1975-76 | 0.23% | 5.86% | -11.55% |
| 1976-77 | 10.62% | 13.84% | 15.51% |
| 1977-78 | 6.89% | 6.16% | 8.13% |
| 1978-79 | 6.05% | 5.04% | 6.86% |
| 1979-80 | 7.37% | 7.27% | 8.56% |
| 1980-81 | 8.92% | 8.94% | 10.14% |
| 1981-82 | 12.44% | 13.06% | 11.00% |
| 1982-83 | 11.76% | 13.42% | 8.99% |
| 1983-84 | 11.65% | 11.35% | 11.63% |
| 1984-85 | 8.98% | 6.97% | 10.61% |
| 1985-86 | 7.62% | 7.33% | 9.76% |
| 1986-87 | 5.84% | 7.28% | 2.96% |
| 1987-88 | 10.13% | 8.70% | 6.97% |
| 1988-89 | 5.50% | 7.09% | 3.40% |
| 1989-90 | 5.53% | 8.14% | 3.56% |
| 1990-91 | 7.23% | 6.07% | 8.99% |
| 1991-92 | 11.97% | 12.13% | 13.59% |
| 1992-93 | 9.46% | 10.96% | 9.51% |
| 1993-94 | 8.98% | 8.00% | 9.76% |
| 1994-95 | 5.92% | 5.68% | 5.96% |
| 1995-96 | 5.93% | 6.23% | 3.94% |
| 1996-97 | 4.22% | 4.88% | 2.99% |
| 1997-98 | 3.92% | 4.12% | 2.98% |
| 1998-99 | 2.97% | 3.83% | 0.99% |
| 1999-2000 | 3.05% | 3.72% | 1.58% |
| 2000-01 | 2.32% | 4.54% | -1.11% |
| 2001-02 | 5.39% | 6.68% | 3.53% |
| 2002-03 | 7.52% | 8.33% | 7.46% |
| 2003-04 | 14.33% | 13.37% | 14.77% |
| 2004-05 | 9.34% | 9.59% | 8.64% |
| 2005-06 | 6.75% | 6.45% | 4.65% |
| 2006-07 | 5.89% | 5.89% | 4.24% |
| 2007-08 | 4.53% | 4.89% | 2.03% |
| 2008-09 | 5.22% | 6.21% | 3.79% |
| 2009-10 | 5.56% | 6.42% | 6.88% |
| 2010-11 | 6.55% | 6.18% | 6.92% |
| 2011-12 | 9.62% | 8.15% | 8.60% |
| 2012-13 | 6.04% | 4.63% | 5.32% |
| 2013-14 | 3.75% | 3.00% | 3.19% |
| 2014-15 | 4.08% | 2.78% | 2.57% |
| 2015-16 | 3.80% | 2.75% | 2.81% |
| 2016-17 | 3.12% | 0.30% | 3.88% |
| 2017-18 | 3.42% | 2.64% | 2.72% |
| 2018-19 | 2.79% | 1.95% | 2.16% |
| 2019-20 | 2.24% | 1.49% | 1.96% |
| 2020-21 | 3.04% | 0.27% | 3.73% |
| 2021-22 | 3.06% | 2.37% | 1.71% |
| 2022-23 | 1.64% | 1.60% | 0.98% |
The data demonstrates that while public college tuition grew rapidly in the 1970s and early 1980s, recent years have seen more moderate increases. The trend underscores the importance of understanding long-term cost growth and how funding for public colleges has shifted since the 1970s, influencing both affordability and budgeting decisions for students and families.
Having reviewed public college costs, it is important to examine the trajectory of tuition and required fees at private institutions, where average private college tuition has historically been higher and more variable.
Tuition and required fees by year (private institutions)
The chart below presents tuition and required fees at private colleges from 1963-64 through 2022-23, including 4-year and 2-year institutions.
- Tuition at 4-year private colleges increased from $1,011 in 1963-64 to $35,248 in 2022-23.
- For 2-year private institutions, tuition rose from $642 in 1963-64 to $17,408 in 2022-23.
- Across all private colleges, average tuition grew from $1,012 in 1963-64 to $34,923 in 2022-23.
Tuition and required fees by year in private institutions
| Academic year | All institutions | 4-year | 2-year |
| 1963-64 | $1,012 | $1,011 | $642 |
| 1968-69 | $1,383 | $1,417 | $956 |
| 1969-70 | $1,533 | $1,562 | $1,034 |
| 1970-71 | $1,684 | $1,706 | $1,109 |
| 1971-72 | $1,820 | $1,832 | $1,172 |
| 1972-73 | $1,898 | $1,948 | $1,221 |
| 1973-74 | $1,989 | $2,045 | $1,303 |
| 1974-75 | $2,117 | $2,130 | $1,367 |
| 1975-76 | $2,272 | $2,291 | $1,427 |
| 1976-77 | $2,467 | $2,534 | $1,592 |
| 1977-78 | $2,624 | $2,700 | $1,706 |
| 1978-79 | $2,867 | $2,958 | $1,831 |
| 1979-80 | $3,130 | $3,225 | $2,062 |
| 1980-81 | $3,498 | $3,617 | $2,413 |
| 1981-82 | $3,953 | $4,113 | $2,605 |
| 1982-83 | $4,439 | $4,639 | $3,008 |
| 1983-84 | $4,851 | $5,093 | $3,099 |
| 1984-85 | $5,315 | $5,556 | $3,485 |
| 1985-86 | $5,789 | $6,121 | $3,672 |
| 1986-87 | $6,316 | $6,658 | $3,684 |
| 1987-88 | $6,988 | $7,116 | $4,161 |
| 1988-89 | $7,461 | $7,722 | $4,817 |
| 1989-90 | $8,147 | $8,396 | $5,196 |
| 1990-91 | $8,772 | $9,083 | $5,570 |
| 1991-92 | $9,419 | $9,759 | $5,754 |
| 1992-93 | $9,942 | $10,294 | $6,059 |
| 1993-94 | $10,572 | $10,952 | $6,370 |
| 1994-95 | $11,111 | $11,481 | $6,914 |
| 1995-96 | $11,864 | $12,243 | $7,094 |
| 1996-97 | $12,498 | $12,881 | $7,236 |
| 1997-98 | $12,801 | $13,344 | $7,464 |
| 1998-99 | $13,428 | $13,973 | $7,854 |
| 1999-2000 | $14,100 | $14,616 | $8,225 |
| 2000-01 | $15,000 | $15,470 | $9,067 |
| 2001-02 | $15,742 | $16,211 | $10,076 |
| 2002-03 | $16,383 | $16,826 | $10,651 |
| 2003-04 | $17,315 | $17,763 | $11,545 |
| 2004-05 | $18,154 | $18,604 | $12,122 |
| 2005-06 | $18,862 | $19,292 | $12,450 |
| 2006-07 | $20,047 | $20,517 | $12,708 |
| 2007-08 | $20,972 | $21,427 | $13,128 |
| 2008-09 | $21,575 | $22,040 | $13,567 |
| 2009-10 | $21,764 | $22,269 | $14,862 |
| 2010-11 | $22,042 | $22,677 | $13,687 |
| 2011-12 | $22,850 | $23,464 | $13,961 |
| 2012-13 | $23,943 | $24,523 | $14,149 |
| 2013-14 | $25,110 | $25,707 | $14,170 |
| 2014-15 | $26,182 | $26,739 | $14,261 |
| 2015-16 | $27,436 | $27,942 | $14,528 |
| 2016-17 | $28,945 | $29,476 | $14,589 |
| 2017-18 | $30,274 | $30,723 | $14,894 |
| 2018-19 | $31,527 | $31,883 | $15,720 |
| 2019-20 | $32,411 | $32,764 | $15,831 |
| 2020-21 | $32,351 | $32,728 | $15,473 |
| 2021-22 | $33,700 | $34,051 | $16,588 |
| 2022-23 | $34,923 | $35,248 | $17,408 |
The data shows that tuition at private colleges has steadily increased over the last several decades, with 4-year institutions experiencing the highest costs. These trends highlight the financial pressures associated with private higher education and emphasize the significance of planning for average private college tuition over time. Compared with public institutions, private colleges consistently demonstrate higher tuition, reinforcing the importance of evaluating long-term affordability for students and families.
To complement the discussion of overall tuition at private institutions, examining year-over-year increases provides insight into how rapidly average private college tuition has changed over time.
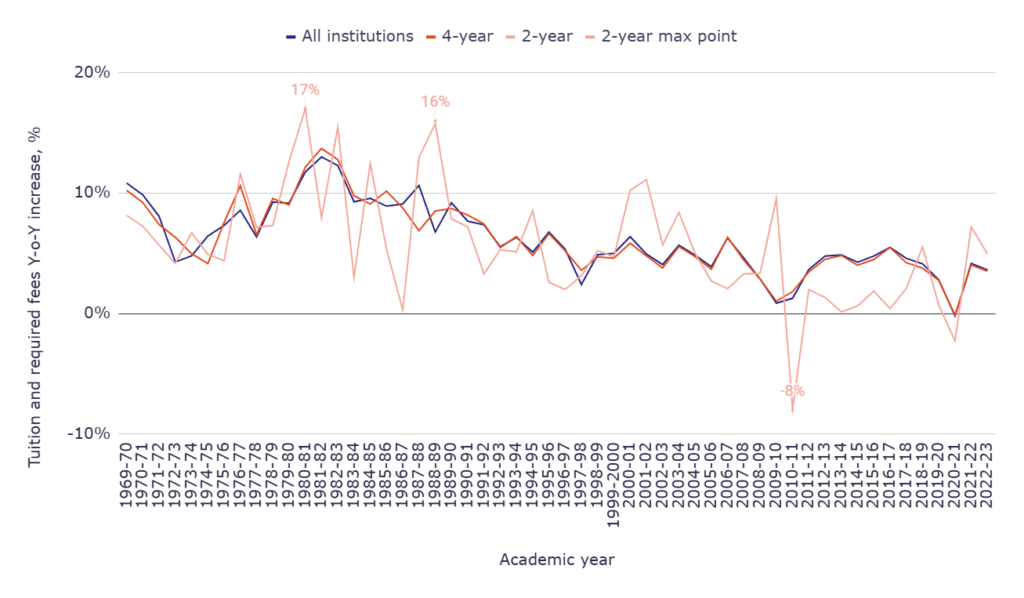
Tuition and required fees Y-o-Y increase (private institutions)
The chart below shows the annual percentage increase in tuition and required fees at private colleges from 1969-70 through 2022-23, including 4-year and 2-year institutions. This data highlights periods of rapid growth, as well as recent trends of more moderate increases, helping to contextualize the increase in average tuition at private universities since 2000.
- College tuition and fees averaged an annual increase over the past 20 years: 3.88%.
- Increase in 4-year private college tuition and fees over the past 20 years: 109.49%.
- Increase in 4-year private college tuition and fees over the past 10 years: 43.73%.
- Increase in 2-year private college tuition and fees over the past 20 years: 63.44%.
- Increase in 2-year private college tuition and fees over the past 10 years: 23.03%.
Y-o-Y increase in tuition and required fees in private institutions
| Academic year | All institutions | 4-year | 2-year |
| 1969-70 | 10.85% | 10.23% | 8.16% |
| 1970-71 | 9.85% | 9.22% | 7.25% |
| 1971-72 | 8.08% | 7.39% | 5.68% |
| 1972-73 | 4.29% | 6.33% | 4.18% |
| 1973-74 | 4.79% | 4.98% | 6.72% |
| 1974-75 | 6.44% | 4.16% | 4.91% |
| 1975-76 | 7.32% | 7.56% | 4.39% |
| 1976-77 | 8.58% | 10.61% | 11.56% |
| 1977-78 | 6.36% | 6.55% | 7.16% |
| 1978-79 | 9.26% | 9.56% | 7.33% |
| 1979-80 | 9.17% | 9.03% | 12.62% |
| 1980-81 | 11.76% | 12.16% | 17.02% |
| 1981-82 | 13.01% | 13.71% | 7.96% |
| 1982-83 | 12.29% | 12.79% | 15.47% |
| 1983-84 | 9.28% | 9.79% | 3.03% |
| 1984-85 | 9.57% | 9.09% | 12.46% |
| 1985-86 | 8.92% | 10.17% | 5.37% |
| 1986-87 | 9.10% | 8.77% | 0.33% |
| 1987-88 | 10.64% | 6.88% | 12.95% |
| 1988-89 | 6.77% | 8.52% | 15.77% |
| 1989-90 | 9.19% | 8.73% | 7.87% |
| 1990-91 | 7.67% | 8.18% | 7.20% |
| 1991-92 | 7.38% | 7.44% | 3.30% |
| 1992-93 | 5.55% | 5.48% | 5.30% |
| 1993-94 | 6.34% | 6.39% | 5.13% |
| 1994-95 | 5.10% | 4.83% | 8.54% |
| 1995-96 | 6.78% | 6.64% | 2.60% |
| 1996-97 | 5.34% | 5.21% | 2.00% |
| 1997-98 | 2.42% | 3.59% | 3.15% |
| 1998-99 | 4.90% | 4.71% | 5.23% |
| 1999-2000 | 5.00% | 4.60% | 4.72% |
| 2000-01 | 6.38% | 5.84% | 10.24% |
| 2001-02 | 4.95% | 4.79% | 11.13% |
| 2002-03 | 4.07% | 3.79% | 5.71% |
| 2003-04 | 5.69% | 5.57% | 8.39% |
| 2004-05 | 4.85% | 4.73% | 5.00% |
| 2005-06 | 3.90% | 3.70% | 2.71% |
| 2006-07 | 6.28% | 6.35% | 2.07% |
| 2007-08 | 4.61% | 4.44% | 3.31% |
| 2008-09 | 2.88% | 2.86% | 3.34% |
| 2009-10 | 0.88% | 1.04% | 9.55% |
| 2010-11 | 1.28% | 1.83% | -7.91% |
| 2011-12 | 3.67% | 3.47% | 2.00% |
| 2012-13 | 4.78% | 4.51% | 1.35% |
| 2013-14 | 4.87% | 4.83% | 0.15% |
| 2014-15 | 4.27% | 4.01% | 0.64% |
| 2015-16 | 4.79% | 4.50% | 1.87% |
| 2016-17 | 5.50% | 5.49% | 0.42% |
| 2017-18 | 4.59% | 4.23% | 2.09% |
| 2018-19 | 4.14% | 3.78% | 5.55% |
| 2019-20 | 2.80% | 2.76% | 0.71% |
| 2020-21 | -0.19% | -0.11% | -2.26% |
| 2021-22 | 4.17% | 4.04% | 7.21% |
| 2022-23 | 3.63% | 3.52% | 4.94% |
The data indicate that while private college tuition grew rapidly in the 1970s and 1980s, growth has slowed in the last decade, though costs remain high. Over the last 20 years, tuition and fees at private institutions have continued to rise substantially, reinforcing the importance of planning for long-term expenses when considering average private college tuition. Compared with public institutions, private colleges maintain consistently higher tuition, emphasizing the financial considerations families must account for.
After analyzing public and private college tuition trends, it is useful to compare tuition trajectories between private nonprofit and for-profit institutions, which show distinct cost patterns over time.
The difference between private for-profit and non-profit institutions
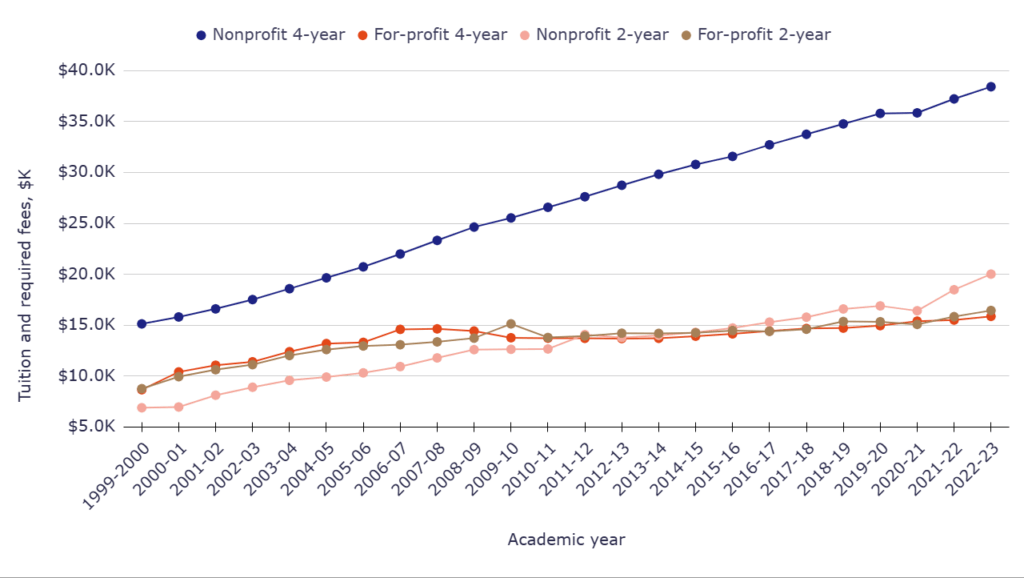
Private for-profit and nonprofit institutions’ tuition and required fees by year
The chart below presents tuition and required fees at private nonprofit and for-profit colleges from 1999-2000 through 2022-23, for both 4-year and 2-year institutions. This comparison highlights the average private college tuition differences between nonprofit and for-profit models, helping students and families evaluate cost implications when choosing between institution types.
- Tuition at 4-year nonprofit colleges rose from $15,131 in 1999-2000 to $38,421 in 2022-23.
- 4-year for-profit colleges increased tuition from $8,661 in 1999-2000 to $15,868 in 2022-23.
- 2-year nonprofit colleges grew from $6,893 in 1999-2000 to $20,019 in 2022-23, while 2-year for-profit colleges rose from $8,766 to $16,444.
Private for-profit and nonprofit institutions’ tuition and required fees by year
| Academic year | Nonprofit 4-year | For-profit 4-year | Nonprofit 2-year | For-profit 2-year |
| 1999-2000 | $15,131 | $8,661 | $6,893 | $8,766 |
| 2000-01 | $15,811 | $10,411 | $6,968 | $9,945 |
| 2001-02 | $16,604 | $11,069 | $8,126 | $10,629 |
| 2002-03 | $17,517 | $11,407 | $8,907 | $11,129 |
| 2003-04 | $18,584 | $12,398 | $9,587 | $12,024 |
| 2004-05 | $19,652 | $13,197 | $9,910 | $12,607 |
| 2005-06 | $20,732 | $13,315 | $10,318 | $12,959 |
| 2006-07 | $21,994 | $14,593 | $10,936 | $13,084 |
| 2007-08 | $23,329 | $14,643 | $11,789 | $13,365 |
| 2008-09 | $24,638 | $14,427 | $12,602 | $13,731 |
| 2009-10 | $25,535 | $13,769 | $12,636 | $15,132 |
| 2010-11 | $26,581 | $13,727 | $12,668 | $13,792 |
| 2011-12 | $27,616 | $13,712 | $14,078 | $13,944 |
| 2012-13 | $28,743 | $13,691 | $13,785 | $14,212 |
| 2013-14 | $29,823 | $13,714 | $14,003 | $14,196 |
| 2014-15 | $30,789 | $13,924 | $14,293 | $14,256 |
| 2015-16 | $31,578 | $14,150 | $14,724 | $14,477 |
| 2016-17 | $32,717 | $14,423 | $15,301 | $14,399 |
| 2017-18 | $33,748 | $14,677 | $15,789 | $14,606 |
| 2018-19 | $34,770 | $14,715 | $16,595 | $15,363 |
| 2019-20 | $35,799 | $14,957 | $16,895 | $15,339 |
| 2020-21 | $35,852 | $15,400 | $16,418 | $15,080 |
| 2021-22 | $37,225 | $15,505 | $18,483 | $15,839 |
| 2022-23 | $38,421 | $15,868 | $20,019 | $16,444 |
The data illustrate that tuition at nonprofit colleges is generally higher than at for-profit institutions, especially for 4-year programs. For-profit institutions show more moderate increases, but 2-year for-profit colleges have occasionally surpassed nonprofit 2-year tuition in certain years. These trends are essential for prospective students to consider when assessing the long-term affordability of average private college tuition across different private institution types.
To further explore tuition trends, examining the annual percentage increase in tuition for private nonprofit and for-profit institutions highlights differences in growth patterns across institution types.
Private for-profit and nonprofit institutions’ tuition and required fees Y-o-Y increase
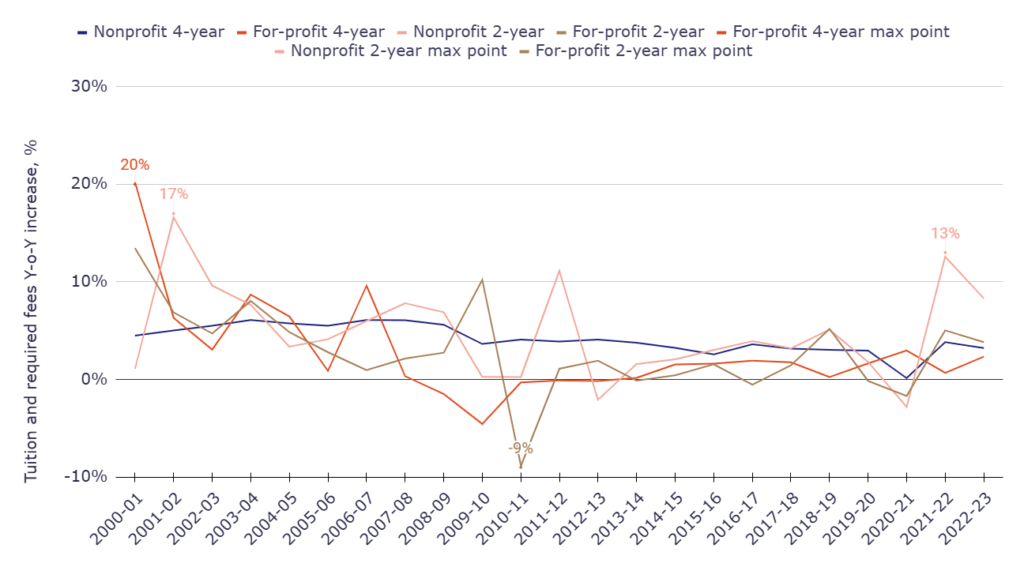
The chart below presents year-over-year tuition increases at private colleges from 2000-01 through 2022-23, for both 4-year and 2-year institutions. This analysis demonstrates how average private college tuition growth varies between nonprofit and for-profit models, offering insight into financial planning for students.
- 4-year nonprofit colleges experienced annual tuition growth ranging from 0.15% in 2020-21 to 6.09% in 2003-04 and 2006-07.
- 4-year for-profit colleges had more volatile increases, with a peak of 20.21% in 2000-01 and a decline from 2008-09 to 2012-13.
- 2-year nonprofit institutions saw their largest yearly increase of 16.62% in 2001-02, while 2-year for-profit colleges peaked at 13.45% in 2000-01.
Y-o-Y increase in private for-profit and nonprofit institutions’ tuition and required fees
| Academic year | Nonprofit 4-year | For-profit 4-year | Nonprofit 2-year | For-profit 2-year |
| 2000-01 | 4.49% | 20.21% | 1.09% | 13.45% |
| 2001-02 | 5.02% | 6.32% | 16.62% | 6.88% |
| 2002-03 | 5.50% | 3.05% | 9.61% | 4.70% |
| 2003-04 | 6.09% | 8.69% | 7.63% | 8.04% |
| 2004-05 | 5.75% | 6.44% | 3.37% | 4.85% |
| 2005-06 | 5.50% | 0.89% | 4.12% | 2.79% |
| 2006-07 | 6.09% | 9.60% | 5.99% | 0.96% |
| 2007-08 | 6.07% | 0.34% | 7.80% | 2.15% |
| 2008-09 | 5.61% | -1.48% | 6.90% | 2.74% |
| 2009-10 | 3.64% | -4.56% | 0.27% | 10.20% |
| 2010-11 | 4.10% | -0.31% | 0.25% | -8.86% |
| 2011-12 | 3.89% | -0.11% | 11.13% | 1.10% |
| 2012-13 | 4.08% | -0.15% | -2.08% | 1.92% |
| 2013-14 | 3.76% | 0.17% | 1.58% | -0.11% |
| 2014-15 | 3.24% | 1.53% | 2.07% | 0.42% |
| 2015-16 | 2.56% | 1.62% | 3.02% | 1.55% |
| 2016-17 | 3.61% | 1.93% | 3.92% | -0.54% |
| 2017-18 | 3.15% | 1.76% | 3.19% | 1.44% |
| 2018-19 | 3.03% | 0.26% | 5.10% | 5.18% |
| 2019-20 | 2.96% | 1.64% | 1.81% | -0.16% |
| 2020-21 | 0.15% | 2.96% | -2.82% | -1.69% |
| 2021-22 | 3.83% | 0.68% | 12.58% | 5.03% |
| 2022-23 | 3.21% | 2.34% | 8.31% | 3.82% |
The data indicate that nonprofit colleges generally show steadier tuition growth, while for-profit institutions experience more fluctuations, including sharp increases and occasional declines. Understanding these patterns is crucial for prospective students considering average private college tuition at different private institution types and planning for long-term educational expenses.
Beyond nominal tuition increases, it is important to consider college tuition inflation to understand how the real cost of higher education has evolved over the decades.
Inflation-adjusted tuition and fee increases over time
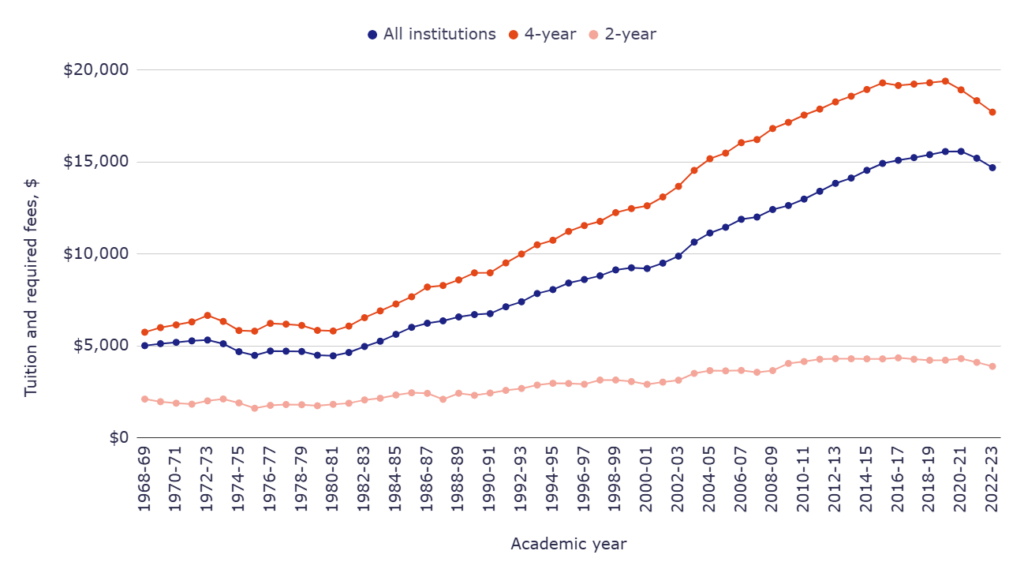
Tuition and required fees by year, in constant 2022-23 dollars
The chart below presents tuition and required fees for all institutions, adjusted to constant 2022-23 dollars, from 1968-69 through 2022-23. These inflation-adjusted figures allow for a more accurate comparison of long-term costs, highlighting how the college tuition inflation rate has affected students’ financial planning over time.
- In 1980-81, inflation-adjusted tuition for 4-year colleges was $5,807, compared with $1,819 for 2-year institutions.
- By 2000-01, 4-year tuition in constant dollars reached $12,617, reflecting substantial growth compared with earlier decades.
- For 2022-23, inflation-adjusted tuition decreased to $17,709 for 4-year institutions and $3,885 for 2-year colleges, showing a recent moderation in real cost growth.
Tuition and required fees by year
| Academic year | All institutions | 4-year | 2-year |
| 1968-69 | $5,011 | $5,741 | $2,104 |
| 1969-70 | $5,118 | $5,990 | $1,963 |
| 1970-71 | $5,190 | $6,139 | $1,882 |
| 1971-72 | $5,271 | $6,302 | $1,827 |
| 1972-73 | $5,317 | $6,653 | $2,008 |
| 1973-74 | $5,114 | $6,328 | $2,111 |
| 1974-75 | $4,683 | $5,833 | $1,896 |
| 1975-76 | $4,480 | $5,799 | $1,606 |
| 1976-77 | $4,718 | $6,221 | $1,764 |
| 1977-78 | $4,710 | $6,179 | $1,810 |
| 1978-79 | $4,693 | $6,111 | $1,798 |
| 1979-80 | $4,489 | $5,840 | $1,741 |
| 1980-81 | $4,458 | $5,807 | $1,819 |
| 1981-82 | $4,639 | $6,074 | $1,878 |
| 1982-83 | $4,964 | $6,532 | $2,060 |
| 1983-84 | $5,249 | $6,900 | $2,150 |
| 1984-85 | $5,625 | $7,275 | $2,327 |
| 1985-86 | $6,007 | $7,668 | $2,447 |
| 1986-87 | $6,229 | $8,196 | $2,417 |
| 1987-88 | $6,359 | $8,281 | $2,093 |
| 1988-89 | $6,572 | $8,586 | $2,422 |
| 1989-90 | $6,701 | $8,969 | $2,308 |
| 1990-91 | $6,750 | $8,971 | $2,434 |
| 1991-92 | $7,124 | $9,509 | $2,579 |
| 1992-93 | $7,395 | $9,992 | $2,682 |
| 1993-94 | $7,844 | $10,492 | $2,867 |
| 1994-95 | $8,059 | $10,741 | $2,964 |
| 1995-96 | $8,415 | $11,223 | $2,953 |
| 1996-97 | $8,607 | $11,539 | $2,910 |
| 1997-98 | $8,810 | $11,767 | $3,140 |
| 1998-99 | $9,130 | $12,244 | $3,142 |
| 1999-2000 | $9,244 | $12,463 | $3,059 |
| 2000-01 | $9,204 | $12,617 | $2,907 |
| 2001-02 | $9,496 | $13,095 | $3,027 |
| 2002-03 | $9,877 | $13,673 | $3,132 |
| 2003-04 | $10,642 | $14,540 | $3,502 |
| 2004-05 | $11,134 | $15,174 | $3,655 |
| 2005-06 | $11,448 | $15,480 | $3,640 |
| 2006-07 | $11,881 | $16,047 | $3,664 |
| 2007-08 | $12,004 | $16,216 | $3,562 |
| 2008-09 | $12,414 | $16,817 | $3,654 |
| 2009-10 | $12,631 | $17,152 | $4,042 |
| 2010-11 | $12,979 | $17,548 | $4,147 |
| 2011-12 | $13,404 | $17,873 | $4,272 |
| 2012-13 | $13,836 | $18,264 | $4,303 |
| 2013-14 | $14,123 | $18,574 | $4,297 |
| 2014-15 | $14,545 | $18,939 | $4,292 |
| 2015-16 | $14,919 | $19,297 | $4,291 |
| 2016-17 | $15,091 | $19,157 | $4,346 |
| 2017-18 | $15,234 | $19,232 | $4,272 |
| 2018-19 | $15,396 | $19,306 | $4,216 |
| 2019-20 | $15,565 | $19,394 | $4,219 |
| 2020-21 | $15,572 | $18,921 | $4,307 |
| 2021-22 | $15,202 | $18,332 | $4,101 |
| 2022-23 | $14,688 | $17,709 | $3,885 |
The data shows that tuition growth has outpaced general inflation since the 1980s, sometimes nearly four times faster, emphasizing that the college cost inflation rate significantly affects affordability. Although nominal costs continue to rise, the real value of tuition shows periods of both rapid increase and stabilization, reflecting changes in policy, funding, and economic conditions. Understanding these trends is crucial for students and families when evaluating the true financial burden of higher education and planning for future college cost-of-living expenses.
Examining tuition growth in constant dollars highlights the college tuition inflation rate and how year-over-year changes affect the real cost of higher education.
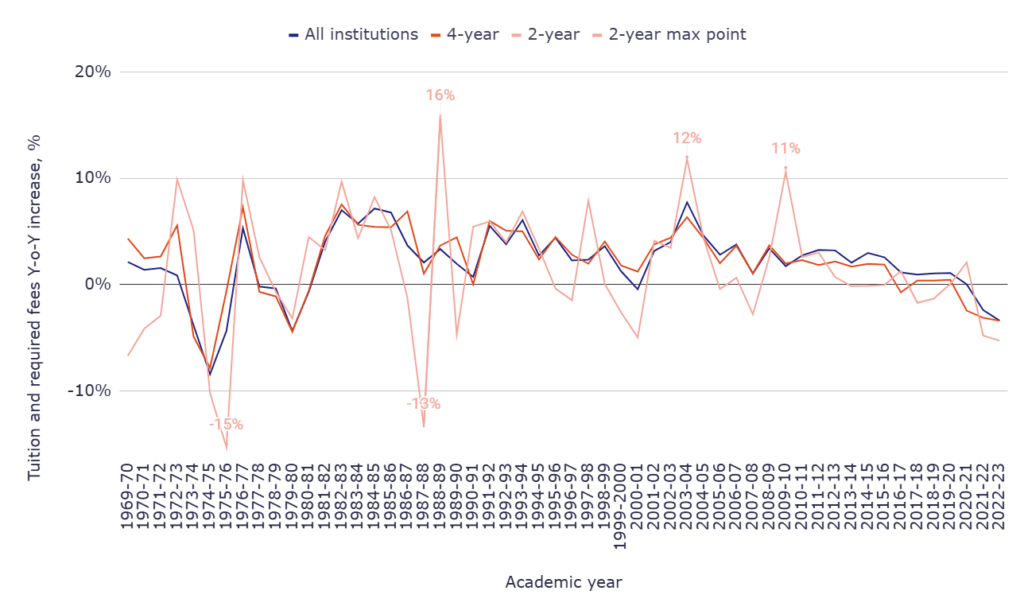
Tuition and required fees in constant 2022-23 dollars, Y-o-Y increase
This chart presents the year-over-year percentage change in tuition and required fees, adjusted to 2022–23 dollars, for all institutions, 4-year, and 2-year colleges. It illustrates how tuition inflation has fluctuated over time, showing periods of both rapid growth and occasional decline in real costs.
- In 1982-83, inflation-adjusted tuition for 4-year institutions rose 7.54% year-over-year, while 2-year colleges increased by 9.69%.
- During 2003-04, 4-year colleges experienced a 6.34% real increase, with 2-year institutions up 11.81% in constant dollars.
- In 2022-23, tuition for 4-year institutions decreased by 3.40% year-over-year, and 2-year colleges declined by 5.27%, indicating a recent drop in real costs.
Y-o-Y increase of tuition and required fees in constant 2022-23 dollars
| Academic year | All institutions | 4-year | 2-year |
| 1969-70 | 2.14% | 4.34% | -6.70% |
| 1970-71 | 1.41% | 2.49% | -4.13% |
| 1971-72 | 1.56% | 2.66% | -2.92% |
| 1972-73 | 0.87% | 5.57% | 9.91% |
| 1973-74 | -3.82% | -4.89% | 5.13% |
| 1974-75 | -8.43% | -7.82% | -10.18% |
| 1975-76 | -4.33% | -0.58% | -15.30% |
| 1976-77 | 5.31% | 7.28% | 9.84% |
| 1977-78 | -0.17% | -0.68% | 2.61% |
| 1978-79 | -0.36% | -1.10% | -0.66% |
| 1979-80 | -4.35% | -4.43% | -3.17% |
| 1980-81 | -0.69% | -0.57% | 4.48% |
| 1981-82 | 4.06% | 4.60% | 3.24% |
| 1982-83 | 7.01% | 7.54% | 9.69% |
| 1983-84 | 5.74% | 5.63% | 4.37% |
| 1984-85 | 7.16% | 5.43% | 8.23% |
| 1985-86 | 6.79% | 5.40% | 5.16% |
| 1986-87 | 3.70% | 6.89% | -1.23% |
| 1987-88 | 2.09% | 1.04% | -13.41% |
| 1988-89 | 3.35% | 3.68% | 15.72% |
| 1989-90 | 1.96% | 4.46% | -4.71% |
| 1990-91 | 0.73% | 0.02% | 5.46% |
| 1991-92 | 5.54% | 6.00% | 5.96% |
| 1992-93 | 3.80% | 5.08% | 3.99% |
| 1993-94 | 6.07% | 5.00% | 6.90% |
| 1994-95 | 2.74% | 2.37% | 3.38% |
| 1995-96 | 4.42% | 4.49% | -0.37% |
| 1996-97 | 2.28% | 2.82% | -1.46% |
| 1997-98 | 2.36% | 1.98% | 7.90% |
| 1998-99 | 3.63% | 4.05% | 0.06% |
| 1999-2000 | 1.25% | 1.79% | -2.64% |
| 2000-01 | -0.43% | 1.24% | -4.97% |
| 2001-02 | 3.17% | 3.79% | 4.13% |
| 2002-03 | 4.01% | 4.41% | 3.47% |
| 2003-04 | 7.75% | 6.34% | 11.81% |
| 2004-05 | 4.62% | 4.36% | 4.37% |
| 2005-06 | 2.82% | 2.02% | -0.41% |
| 2006-07 | 3.78% | 3.66% | 0.66% |
| 2007-08 | 1.04% | 1.05% | -2.78% |
| 2008-09 | 3.42% | 3.71% | 2.58% |
| 2009-10 | 1.75% | 1.99% | 10.62% |
| 2010-11 | 2.76% | 2.31% | 2.60% |
| 2011-12 | 3.27% | 1.85% | 3.01% |
| 2012-13 | 3.22% | 2.19% | 0.73% |
| 2013-14 | 2.07% | 1.70% | -0.14% |
| 2014-15 | 2.99% | 1.97% | -0.12% |
| 2015-16 | 2.57% | 1.89% | -0.02% |
| 2016-17 | 1.15% | -0.73% | 1.28% |
| 2017-18 | 0.95% | 0.39% | -1.70% |
| 2018-19 | 1.06% | 0.38% | -1.31% |
| 2019-20 | 1.10% | 0.46% | 0.07% |
| 2020-21 | 0.04% | -2.44% | 2.09% |
| 2021-22 | -2.38% | -3.11% | -4.78% |
| 2022-23 | -3.38% | -3.40% | -5.27% |
The data demonstrates that, even after adjusting for inflation, tuition growth has historically outpaced general inflation, particularly since the 1980s. Despite occasional declines, long-term trends show that the real cost of attending college has increased significantly, impacting affordability and planning for college costs of living. These fluctuations highlight the importance of considering both nominal and real tuition growth when evaluating educational expenses.
By comparing tuition in constant 2022-23 dollars to the 1968-69 base year, we can see the cumulative impact of college tuition inflation on the real cost of higher education over the decades.
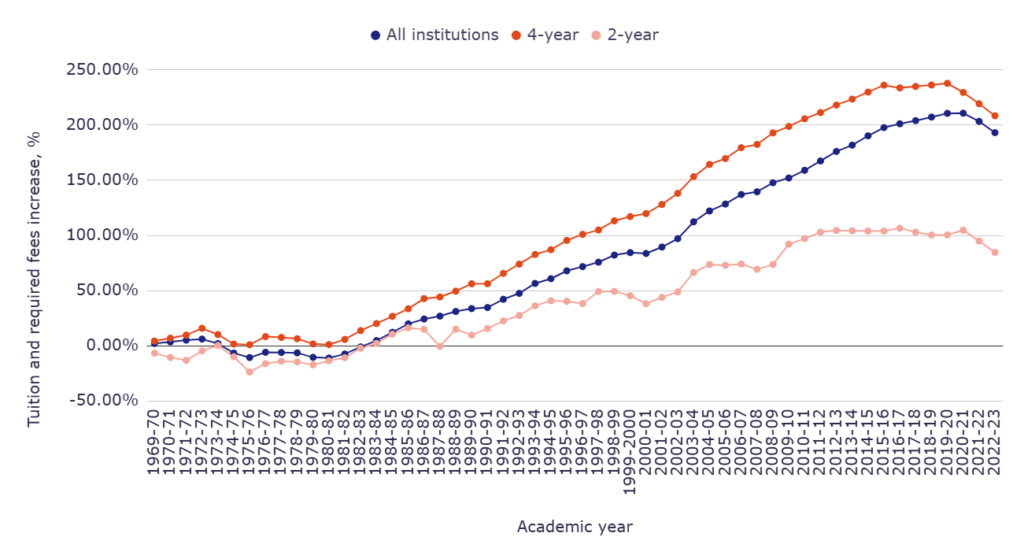
Tuition and required fees in constant 2022-23 dollars increase compared to the 1968-69 base year
This chart illustrates the percentage increase in tuition and required fees, adjusted for inflation, for all institutions, 4-year and 2-year colleges, relative to 1968-69. It highlights the dramatic rise in the cost of higher education in real terms and provides context for long-term affordability challenges.
- By 1986-87, tuition at 4-year colleges had increased 42.76% in constant dollars compared to 1968-69, while 2-year colleges rose 14.88%.
- In 2003-04, 4-year institutions saw a 153.27% increase, and 2-year institutions 66.44% relative to the 1968-69 base year.
- By 2022-23, cumulative tuition growth reached 208.47% for 4-year colleges and 84.65% for 2-year colleges, demonstrating the persistent upward pressure on real college costs.
Tuition and required fees increased since 1968-69 in constant 2022-23 dollars
| Academic year | All institutions | 4-year | 2-year |
| 1969-70 | 2.14% | 4.34% | -6.70% |
| 1970-71 | 3.57% | 6.93% | -10.55% |
| 1971-72 | 5.19% | 9.77% | -13.17% |
| 1972-73 | 6.11% | 15.89% | -4.56% |
| 1973-74 | 2.06% | 10.22% | 0.33% |
| 1974-75 | -6.55% | 1.60% | -9.89% |
| 1975-76 | -10.60% | 1.01% | -23.67% |
| 1976-77 | -5.85% | 8.36% | -16.16% |
| 1977-78 | -6.01% | 7.63% | -13.97% |
| 1978-79 | -6.35% | 6.44% | -14.54% |
| 1979-80 | -10.42% | 1.72% | -17.25% |
| 1980-81 | -11.04% | 1.15% | -13.55% |
| 1981-82 | -7.42% | 5.80% | -10.74% |
| 1982-83 | -0.94% | 13.78% | -2.09% |
| 1983-84 | 4.75% | 20.19% | 2.19% |
| 1984-85 | 12.25% | 26.72% | 10.60% |
| 1985-86 | 19.88% | 33.57% | 16.30% |
| 1986-87 | 24.31% | 42.76% | 14.88% |
| 1987-88 | 26.90% | 44.24% | -0.52% |
| 1988-89 | 31.15% | 49.56% | 15.11% |
| 1989-90 | 33.73% | 56.23% | 9.70% |
| 1990-91 | 34.70% | 56.26% | 15.68% |
| 1991-92 | 42.17% | 65.63% | 22.58% |
| 1992-93 | 47.58% | 74.05% | 27.47% |
| 1993-94 | 56.54% | 82.76% | 36.26% |
| 1994-95 | 60.83% | 87.09% | 40.87% |
| 1995-96 | 67.93% | 95.49% | 40.35% |
| 1996-97 | 71.76% | 100.99% | 38.31% |
| 1997-98 | 75.81% | 104.96% | 49.24% |
| 1998-99 | 82.20% | 113.27% | 49.33% |
| 1999-2000 | 84.47% | 117.09% | 45.39% |
| 2000-01 | 83.68% | 119.77% | 38.17% |
| 2001-02 | 89.50% | 128.10% | 43.87% |
| 2002-03 | 97.11% | 138.16% | 48.86% |
| 2003-04 | 112.37% | 153.27% | 66.44% |
| 2004-05 | 122.19% | 164.31% | 73.72% |
| 2005-06 | 128.46% | 169.64% | 73.00% |
| 2006-07 | 137.10% | 179.52% | 74.14% |
| 2007-08 | 139.55% | 182.46% | 69.30% |
| 2008-09 | 147.73% | 192.93% | 73.67% |
| 2009-10 | 152.07% | 198.76% | 92.11% |
| 2010-11 | 159.01% | 205.66% | 97.10% |
| 2011-12 | 167.49% | 211.32% | 103.04% |
| 2012-13 | 176.11% | 218.13% | 104.52% |
| 2013-14 | 181.84% | 223.53% | 104.23% |
| 2014-15 | 190.26% | 229.89% | 103.99% |
| 2015-16 | 197.73% | 236.13% | 103.94% |
| 2016-17 | 201.16% | 233.69% | 106.56% |
| 2017-18 | 204.01% | 234.99% | 103.04% |
| 2018-19 | 207.24% | 236.28% | 100.38% |
| 2019-20 | 210.62% | 237.82% | 100.52% |
| 2020-21 | 210.76% | 229.58% | 104.71% |
| 2021-22 | 203.37% | 219.32% | 94.91% |
| 2022-23 | 193.12% | 208.47% | 84.65% |
Over the last five decades, tuition growth outpaced inflation considerably, particularly for 4-year colleges. While 2-year institutions have experienced more moderate increases, the long-term trend shows that attending college today costs more than double in real terms for 4-year programs compared to the late 1960s. These cumulative increases emphasize the importance of understanding both nominal and inflation-adjusted tuition growth when planning for higher education expenses.
Tuition and required fees vary widely across U.S. states, reflecting differences in state funding, local policies, and higher education priorities. The data for the 2022-23 academic year highlights these regional variations for in-state students at 4-year public institutions.
Tuition and required fees by state
Tuition and required fees in 4-year public institutions in 2022-23 for in-state students by state
The following table shows the average tuition and required fees by state for 4-year public colleges for in-state students. States in the Northeast generally report the highest tuition costs, while states in the South and West often offer lower in-state tuition.
- Highest in-state tuition: Vermont ($17,600), New Hampshire ($17,019), and Pennsylvania ($16,217) top the list, highlighting the Northeast’s comparatively high public college costs.
- Lowest in-state tuition: Wyoming ($5,100), Florida ($4,540), and the District of Columbia ($6,152) represent the most affordable options for in-state students.
- Moderate-cost states: Most Midwest and Southern states, such as Indiana ($9,886), Iowa ($10,121), and Georgia ($7,075), fall into a mid-range tuition bracket.
Tuition and required fees in 4-year public institutions for in-state students by state
| State | Tuition and required fees |
| Alabama | $11,081 |
| Alaska | $8,291 |
| Arizona | $11,768 |
| Arkansas | $8,879 |
| California | $8,637 |
| Colorado | $9,798 |
| Connecticut | $15,763 |
| Delaware | $11,922 |
| District of Columbia | $6,152 |
| Florida | $4,540 |
| Georgia | $7,075 |
| Hawaii | $10,484 |
| Idaho | $7,640 |
| Illinois | $14,921 |
| Indiana | $9,886 |
| Iowa | $10,121 |
| Kansas | $9,274 |
| Kentucky | $11,299 |
| Louisiana | $9,843 |
| Maine | $10,813 |
| Maryland | $10,041 |
| Massachusetts | $14,345 |
| Michigan | $14,718 |
| Minnesota | $12,873 |
| Mississippi | $9,120 |
| Missouri | $9,926 |
| Montana | $7,299 |
| Nebraska | $8,862 |
| Nevada | $6,723 |
| New Hampshire | $17,019 |
| New Jersey | $15,265 |
| New Mexico | $7,526 |
| New York | $8,575 |
| North Carolina | $7,327 |
| North Dakota | $9,728 |
| Ohio | $10,922 |
| Oklahoma | $8,519 |
| Oregon | $12,424 |
| Pennsylvania | $16,217 |
| Rhode Island | $14,744 |
| South Carolina | $12,604 |
| South Dakota | $9,079 |
| Tennessee | $10,437 |
| Texas | $8,195 |
| Utah | $7,215 |
| Vermont | $17,600 |
| Virginia | $14,825 |
| Washington | $8,006 |
| West Virginia | $8,715 |
| Wisconsin | $8,974 |
| Wyoming | $5,100 |
State-level tuition differences are largely driven by the level of state funding for public institutions and regional economic conditions. Students seeking more affordable public college options may consider states with lower in-state tuition, while those prioritizing proximity to home or specific programs may weigh the trade-off between cost and educational opportunities.
Tuition for out-of-state students is significantly higher than in-state rates, reflecting the limited state subsidy for non-resident enrollment. The following data highlights the wide variations in out-of-state costs across U.S. states for the 2022-23 academic year.
Tuition and required fees in 4-year public institutions in 2022-23 for out-of-state students by state
Out-of-state tuition can more than double in some states compared to in-state fees. States with larger public university systems or higher funding demands often charge the highest out-of-state tuition.
- Highest out-of-state tuition: Vermont ($41,900), Michigan ($41,324), and Connecticut ($37,907) show the most expensive options for non-residents.
- Lowest out-of-state tuition: South Dakota ($12,987), District of Columbia ($13,004), and North Dakota ($14,687) provide the most affordable out-of-state alternatives.
- Notable regional patterns: Western states like California ($32,967) and Oregon ($35,960), and Northeastern states like Massachusetts ($34,245) maintain higher tuition, whereas Southern and some Midwest states like Mississippi ($21,531) and Texas ($24,743) are comparatively lower.
Tuition and required fees in 4-year public institutions for out-of-state students by state
| State | Tuition and required fees |
| Alabama | $28,315 |
| Alaska | $24,410 |
| Arizona | $28,506 |
| Arkansas | $23,091 |
| California | $32,967 |
| Colorado | $32,476 |
| Connecticut | $37,907 |
| Delaware | $33,812 |
| District of Columbia | $13,004 |
| Florida | $17,831 |
| Georgia | $24,331 |
| Hawaii | $32,769 |
| Idaho | $25,404 |
| Illinois | $30,027 |
| Indiana | $30,448 |
| Iowa | $29,072 |
| Kansas | $23,713 |
| Kentucky | $26,640 |
| Louisiana | $23,573 |
| Maine | $30,244 |
| Maryland | $26,721 |
| Massachusetts | $34,245 |
| Michigan | $41,324 |
| Minnesota | $26,719 |
| Mississippi | $21,531 |
| Missouri | $23,932 |
| Montana | $28,682 |
| Nebraska | $21,539 |
| Nevada | $24,443 |
| New Hampshire | $33,850 |
| New Jersey | $30,271 |
| New Mexico | $21,842 |
| New York | $20,637 |
| North Carolina | $23,155 |
| North Dakota | $14,687 |
| Ohio | $27,441 |
| Oklahoma | $22,928 |
| Oregon | $35,960 |
| Pennsylvania | $31,844 |
| Rhode Island | $33,879 |
| South Carolina | $33,346 |
| South Dakota | $12,987 |
| Tennessee | $24,920 |
| Texas | $24,743 |
| Utah | $23,108 |
| Vermont | $41,900 |
| Virginia | $37,730 |
| Washington | $30,444 |
| West Virginia | $23,521 |
| Wisconsin | $29,256 |
| Wyoming | $15,215 |
The disparity between in-state and out-of-state tuition underscores the financial incentive for students to attend public institutions within their home state. Families planning for college should weigh out-of-state tuition costs against potential financial aid, scholarships, and program offerings.
Tuition at private colleges is generally higher than at public institutions and does not vary based on residency, reflecting the self-funded nature of these institutions. The following data shows tuition levels across U.S. states for the 2022–23 academic year.
Tuition and required fees in 4-year private institutions in 2022-23 by state
Private colleges often charge significantly more than public universities, with some of the highest rates concentrated in the Northeast and along the West Coast. Conversely, some Midwestern and Southern states have relatively lower tuition at private institutions.
- Highest tuition: Massachusetts ($53,789), Vermont ($50,094), and Rhode Island ($49,792) have the most expensive private college tuition.
- Lowest tuition: Idaho ($6,970), Utah ($8,123), and West Virginia ($12,133) represent the most affordable private college options.
- Notable regional patterns: Northeastern and West Coast states consistently charge higher tuition, while the Midwest and Mountain West regions often offer comparatively lower rates.
Tuition and required fees in 4-year private institutions by state
| State | Tuition and required fees |
| Alabama | $17,687 |
| Alaska | $20,148 |
| Arizona | $13,485 |
| Arkansas | $24,798 |
| California | $42,017 |
| Colorado | $27,474 |
| Connecticut | $44,931 |
| Delaware | $12,154 |
| District of Columbia | $47,066 |
| Florida | $30,928 |
| Georgia | $32,114 |
| Hawaii | $21,851 |
| Idaho | $6,970 |
| Illinois | $37,646 |
| Indiana | $37,987 |
| Iowa | $37,623 |
| Kansas | $31,116 |
| Kentucky | $28,001 |
| Louisiana | $44,485 |
| Maine | $38,972 |
| Maryland | $48,240 |
| Massachusetts | $53,789 |
| Michigan | $33,385 |
| Minnesota | $35,914 |
| Mississippi | $20,042 |
| Missouri | $30,660 |
| Montana | $31,464 |
| Nebraska | $26,002 |
| Nevada | $24,246 |
| New Hampshire | $19,557 |
| New Jersey | $40,366 |
| New Mexico | $27,340 |
| New York | $46,280 |
| North Carolina | $40,176 |
| North Dakota | $16,990 |
| Ohio | $37,610 |
| Oklahoma | $31,140 |
| Oregon | $47,224 |
| Pennsylvania | $47,222 |
| Rhode Island | $49,792 |
| South Carolina | $28,730 |
| South Dakota | $28,687 |
| Tennessee | $31,885 |
| Texas | $40,142 |
| Utah | $8,123 |
| Vermont | $50,094 |
| Virginia | $24,043 |
| Washington | $42,339 |
| West Virginia | $12,133 |
| Wisconsin | $37,686 |
| Wyoming | N/A |
Unlike public universities, private institutions’ tuition is largely uniform for all students regardless of state, emphasizing the importance of financial planning, scholarships, and aid when considering private higher education.
Two-year public colleges offer a more affordable pathway to higher education, particularly for in-state students. Tuition levels vary widely across the U.S., reflecting differences in state funding and local cost of living.
Tuition and required fees in 2-year public institutions in 2022-23 for in-state students by state
In-state tuition at community colleges ranges from just over $1,200 in California to more than $7,400 in South Dakota. Several states, including Alaska, Delaware, the District of Columbia, Florida, and Nevada, did not report in-state tuition data for this academic year.
- Highest tuition: South Dakota ($7,412), New Hampshire ($7,108), and Vermont ($6,920) have the highest in-state tuition among 2-year public colleges.
- Lowest tuition: California ($1,286), New Mexico ($1,923), and Arizona ($2,160) represent the most affordable options for in-state students.
- Regional trends: Northern and Northeastern states generally charge higher tuition, while Western and Southwestern states tend to have lower rates for community college students.
Tuition and required fees in 2-year public institutions for in-state students by state
| State | Tuition and required fees |
| Alabama | $5,039 |
| Alaska | N/A |
| Arizona | $2,160 |
| Arkansas | $3,657 |
| California | $1,286 |
| Colorado | $3,426 |
| Connecticut | $4,758 |
| Delaware | N/A |
| District of Columbia | N/A |
| Florida | N/A |
| Georgia | $3,134 |
| Hawaii | $3,227 |
| Idaho | $3,361 |
| Illinois | $4,249 |
| Indiana | $4,637 |
| Iowa | $5,583 |
| Kansas | $3,645 |
| Kentucky | $4,588 |
| Louisiana | $4,367 |
| Maine | $3,779 |
| Maryland | $4,408 |
| Massachusetts | $5,564 |
| Michigan | $3,963 |
| Minnesota | $6,049 |
| Mississippi | $3,688 |
| Missouri | $4,077 |
| Montana | $3,950 |
| Nebraska | $3,408 |
| Nevada | N/A |
| New Hampshire | $7,108 |
| New Jersey | $4,981 |
| New Mexico | $1,923 |
| New York | $5,755 |
| North Carolina | $2,527 |
| North Dakota | $5,610 |
| Ohio | $4,630 |
| Oklahoma | $4,413 |
| Oregon | $5,376 |
| Pennsylvania | $5,717 |
| Rhode Island | $5,090 |
| South Carolina | $4,987 |
| South Dakota | $7,412 |
| Tennessee | $4,440 |
| Texas | $2,931 |
| Utah | $4,257 |
| Vermont | $6,920 |
| Virginia | $5,220 |
| Washington | $4,623 |
| West Virginia | $4,600 |
| Wisconsin | $4,656 |
| Wyoming | $4,192 |
Community colleges remain a cost-effective option for students seeking an associate degree or transferring to a four-year university, especially for residents who benefit from reduced in-state tuition.
Tuition for out-of-state students at two-year public colleges is substantially higher than for in-state students, reflecting the lower level of state subsidy for nonresidents.
Tuition and required fees in 2-year public institutions in 2022-23 for out-of-state students
Out-of-state tuition ranges from $4,308 in Nebraska to over $17,000 in Tennessee. Several states, including Alaska, Delaware, the District of Columbia, Florida, and Nevada, did not report tuition data for nonresident students in this academic year.
- Highest tuition: Tennessee ($17,258), Kentucky ($15,502), and New Hampshire ($15,348) represent the steepest costs for out-of-state students.
- Lowest tuition: Nebraska ($4,308), Kansas ($4,826), and Louisiana ($5,085) provide the most affordable options for non-residents.
- Regional trends: Southern and Northeastern states generally charge higher out-of-state tuition, while Midwest states tend to be more economical.
Tuition and required fees in 2-year public institutions for out-of-state students by state
| State | Tuition and required fees |
| Alabama | $9,432 |
| Alaska | N/A |
| Arizona | $7,444 |
| Arkansas | $5,151 |
| California | $9,338 |
| Colorado | $7,527 |
| Connecticut | $14,176 |
| Delaware | N/A |
| District of Columbia | N/A |
| Florida | N/A |
| Georgia | $8,259 |
| Hawaii | $8,400 |
| Idaho | $8,243 |
| Illinois | $11,693 |
| Indiana | $8,927 |
| Iowa | $6,897 |
| Kansas | $4,826 |
| Kentucky | $15,502 |
| Louisiana | $5,085 |
| Maine | $6,658 |
| Maryland | $9,878 |
| Massachusetts | $10,635 |
| Michigan | $7,493 |
| Minnesota | $6,790 |
| Mississippi | $6,233 |
| Missouri | $7,613 |
| Montana | $9,726 |
| Nebraska | $4,308 |
| Nevada | N/A |
| New Hampshire | $15,348 |
| New Jersey | $8,558 |
| New Mexico | $6,612 |
| New York | $9,145 |
| North Carolina | $8,522 |
| North Dakota | $6,642 |
| Ohio | $8,297 |
| Oklahoma | $9,919 |
| Oregon | $9,154 |
| Pennsylvania | $13,177 |
| Rhode Island | $13,552 |
| South Carolina | $10,498 |
| South Dakota | $7,257 |
| Tennessee | $17,258 |
| Texas | $7,863 |
| Utah | $13,701 |
| Vermont | $13,640 |
| Virginia | $11,511 |
| Washington | $8,295 |
| West Virginia | $10,776 |
| Wisconsin | $6,686 |
| Wyoming | $9,990 |
For students attending a community college outside their home state, tuition can be two to three times higher than for in-state students, underscoring the value of residency status in controlling college costs.
Tuition fees vary widely across the nation’s leading universities, reflecting differences in selectivity, prestige, and institutional resources.
Top 10 national universities’ tuition and fees
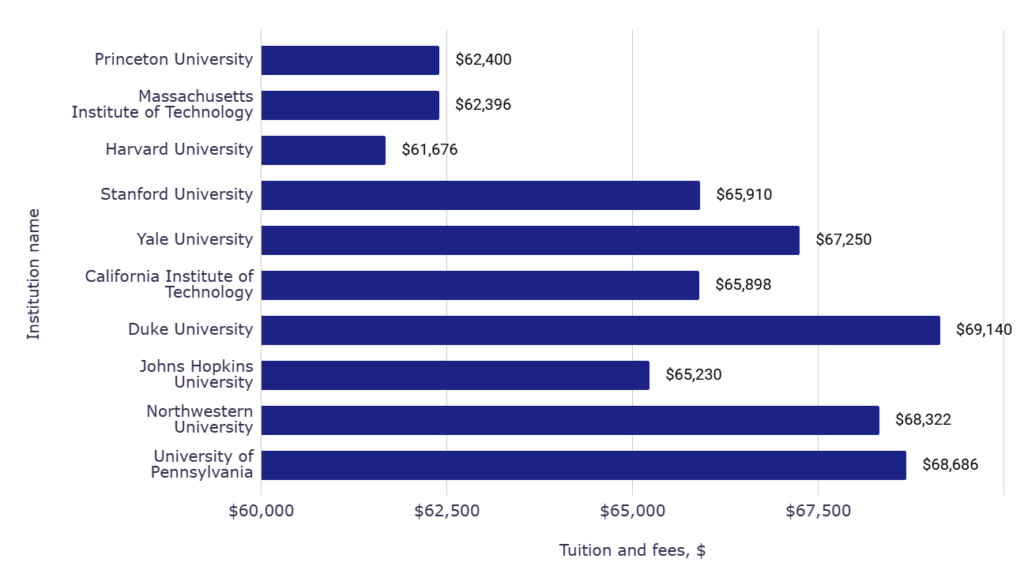
For the 2022-23 academic year, tuition and fees for top-ranked universities range from approximately $28,658 at the University of Florida to over $71,647 at the University of Southern California. Ivy League schools and highly selective private institutions generally report tuition above $60,000. These institutions may be considered the most expensive public universities for out-of-state students
- Ivy League tuition: Harvard University charges $61,676, Yale University $67,250, and Princeton University $62,400, illustrating consistently high costs among elite private institutions.
- More affordable options: Public universities like the University of Florida ($28,658), Purdue University ($28,794), and the University of Georgia ($31,678) provide significantly lower tuition, especially for in-state students.
Top 50 national universities’ tuition and fees
| Rank | Name | Tuition and fees |
| 1 | Princeton University | $62,400 |
| 2 | Massachusetts Institute of Technology | $62,396 |
| 3 | Harvard University | $61,676 |
| 4 | Stanford University | $65,910 |
| 5 | Yale University | $67,250 |
| 6 | California Institute of Technology | $65,898 |
| 6 | Duke University | $69,140 |
| 6 | Johns Hopkins University | $65,230 |
| 6 | Northwestern University | $68,322 |
| 10 | University of Pennsylvania | $68,686 |
| 11 | Cornell University | $69,314 |
| 11 | University of Chicago | $69,324 |
| 13 | Brown University | $71,312 |
| 13 | Columbia University | N/A |
| 15 | Dartmouth College | $68,019 |
| 15 | University of California, Los Angeles | $46,503 |
| 17 | University of California, Berkeley | $51,032 |
| 18 | Rice University | $60,709 |
| 18 | University of Notre Dame | $65,025 |
| 18 | Vanderbilt University | $67,498 |
| 21 | Carnegie Mellon University | $65,636 |
| 21 | University of Michigan, Ann Arbor | $63,081 |
| 21 | Washington University in St. Louis | $65,790 |
| 24 | Emory University | $64,280 |
| 24 | Georgetown University | $68,016 |
| 24 | University of Virginia | $60,907 |
| 27 | University of North Carolina, Chapel Hill | $41,211 |
| 27 | University of Southern California | $71,647 |
| 29 | University of California, San Diego | $51,015 |
| 30 | New York University | $62,796 |
| 30 | University of Florida | $28,658 |
| 30 | The University of Texas, Austin | $42,778 |
| 33 | Georgia Institute of Technology | $34,484 |
| 33 | University of California, Davis | $47,682 |
| 33 | University of California, Irvine | $46,626 |
| 33 | University of Illinois Urbana-Champaign | $36,760 |
| 37 | Boston College | $70,702 |
| 37 | Tufts University | $70,704 |
| 39 | University of California, Santa Barbara | $47,755 |
| 39 | University of Wisconsin, Madison | $42,103 |
| 41 | Boston University | $68,102 |
| 41 | The Ohio State University | $40,022 |
| 41 | Rutgers University, New Brunswick | $37,441 |
| 44 | University of Maryland, College Park | $41,186 |
| 44 | University of Rochester | $67,124 |
| 46 | Lehigh University | $64,980 |
| 46 | Purdue University, Main Campus | $28,794 |
| 46 | University of Georgia | $31,678 |
| 46 | University of Washington | $43,209 |
| 46 | Wake Forest University | $67,642 |
- The average cost of Princeton University is $62,400.
- The average cost of Massachusetts Institute of Technology is $62,396.
- The average cost of Harvard University is $61,676.
- The average cost of Stanford University is $65,910.
- The average cost of Yale University is $67,250.
- The average cost of the California Institute of Technology is $65,898.
- The average cost of Duke University is $69,140.
- The average cost of Johns Hopkins University is $65,230.
- The average cost of Northwestern University is $68,322.
- The average cost of the University of Pennsylvania is $68,686.
While top-ranked private universities often exceed $60,000 annually for tuition alone, large public universities can offer substantially lower costs, making state residency a major factor in affordability. These differences highlight the trade-offs students face between institutional prestige and financial considerations.
Drivers of rising college costs
Over the past several decades, college tuition and fees have increased at rates well above general inflation, leaving many students and families asking, “Why did my tuition go up?” and “How did college get so expensive?” Understanding the factors behind these increases is essential for planning and financial decision-making.
Decreased public funding
One of the main reasons tuition has risen is the steady decline in state and federal funding for public colleges. As government contributions shrink, universities must rely more heavily on tuition and fees to cover operating costs. This shift answers the question, “Why are colleges raising tuition?”, particularly for in-state students who historically benefited from subsidized rates.
Expansion of campus services and facilities
Colleges increasingly invest in amenities such as modern dormitories, student centers, recreational facilities, and high-tech classrooms. While these improvements enhance the student experience, they also increase operational costs, which are passed on to students in the form of higher tuition.
Growth in administrative costs
Higher education has seen significant growth in administrative staff relative to faculty. Expanding offices for compliance, student services, and campus operations contributes to rising expenses, creating upward pressure on tuition.
Increased demand for higher education
As more students seek college degrees, demand has driven tuition growth. Popular universities with limited capacity can charge more, reflecting market dynamics. The combination of high demand and limited supply partially explains why college is so expensive in the United States compared to other countries.
Financial aid and tuition discounting
Ironically, the widespread availability of financial aid and loans can indirectly drive tuition increases. With students able to borrow funds, colleges may raise sticker prices without losing applicants, a phenomenon sometimes called the “Bennett Hypothesis.”
Inflation and rising operational costs
Even outside of direct education expenses, universities face inflationary pressures in salaries, healthcare, utilities, and technology. These costs accumulate annually, contributing to the steady increase in tuition and fees.
The rise in college costs is not attributable to a single factor. Instead, it results from a combination of reduced public funding, expanding services, administrative growth, high demand, financial aid dynamics, and general inflation. For students wondering, “What causes tuition prices to rise so much?”, these intertwined drivers provide a clear explanation.
College cost forecast
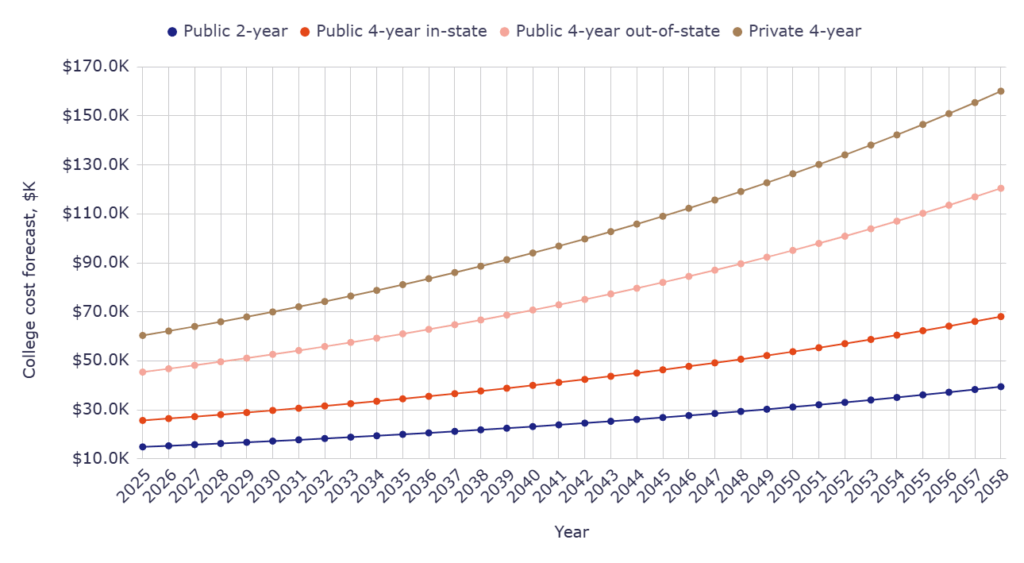
College tuition and fees are expected to continue rising over the next several decades, reflecting ongoing trends in higher education funding, inflation, and institutional expenses.
- Public 2-year colleges: Tuition is projected to grow from $14,873 in 2025 to $39,448 by 2058, more than doubling over the period.
- Public 4-year institutions: In-state tuition will increase from $25,668 in 2025 to $68,080 by 2058, while out-of-state tuition rises from $45,413 to $120,451, demonstrating that residency remains a major cost factor.
- Private 4-year universities: Tuition is expected to climb from $60,358 in 2025 to $160,090 by 2058, highlighting the steepest projected growth among all institution types.
Forecast of college costs by year
| Year | Public 2-year | Public 4-year in-state | Public 4-year out-of-state | Private 4-year |
| 2025 | $14,873 | $25,668 | $45,413 | $60,358 |
| 2026 | $15,319 | $26,438 | $46,775 | $62,169 |
| 2027 | $15,779 | $27,231 | $48,179 | $64,034 |
| 2028 | $16,252 | $28,048 | $49,624 | $65,955 |
| 2029 | $16,740 | $28,890 | $51,113 | $67,933 |
| 2030 | $17,242 | $29,756 | $52,646 | $69,971 |
| 2031 | $17,759 | $30,649 | $54,226 | $72,071 |
| 2032 | $18,292 | $31,568 | $55,852 | $74,233 |
| 2033 | $18,841 | $32,515 | $57,528 | $76,460 |
| 2034 | $19,406 | $33,491 | $59,254 | $78,754 |
| 2035 | $19,988 | $34,496 | $61,031 | $81,116 |
| 2036 | $20,588 | $35,531 | $62,862 | $83,550 |
| 2037 | $21,205 | $36,596 | $64,748 | $86,056 |
| 2038 | $21,842 | $37,694 | $66,691 | $88,638 |
| 2039 | $22,497 | $38,825 | $68,691 | $91,297 |
| 2040 | $23,172 | $39,990 | $70,752 | $94,036 |
| 2041 | $23,867 | $41,190 | $72,875 | $96,857 |
| 2042 | $24,583 | $42,425 | $75,061 | $99,763 |
| 2043 | $25,320 | $43,698 | $77,313 | $102,755 |
| 2044 | $26,080 | $45,009 | $79,632 | $105,838 |
| 2045 | $26,862 | $46,359 | $82,021 | $109,013 |
| 2046 | $27,668 | $47,750 | $84,482 | $112,284 |
| 2047 | $28,498 | $49,183 | $87,016 | $115,652 |
| 2048 | $29,353 | $50,658 | $89,626 | $119,122 |
| 2049 | $30,234 | $52,178 | $92,315 | $122,695 |
| 2050 | $31,141 | $53,743 | $95,085 | $126,376 |
| 2051 | $32,075 | $55,355 | $97,937 | $130,168 |
| 2052 | $33,037 | $57,016 | $100,875 | $134,073 |
| 2053 | $34,028 | $58,727 | $103,902 | $138,095 |
| 2054 | $35,049 | $60,488 | $107,019 | $142,238 |
| 2055 | $36,101 | $62,303 | $110,229 | $146,505 |
| 2056 | $37,184 | $64,172 | $113,536 | $150,900 |
| 2057 | $38,299 | $66,097 | $116,942 | $155,427 |
| 2058 | $39,448 | $68,080 | $120,451 | $160,090 |
How much will 4 years of college cost in 2035?
- By 2035, four years at a public in-state college will cost about $137,984, while a private 4-year degree could reach $324,464.
How much will college cost in 2040?
- In 2040, the total cost for four years is projected at $159,960 for public in-state and up to $376,144 for private universities.
How much will college cost in 18 years?
- By 2043, a 4-year degree may cost around $174,792 at public in-state colleges and as high as $411,020 at private institutions.
How much will college cost in 15 years?
- In 2038, completing four years will cost roughly $150,776 at public in-state colleges and $354,552 at private universities.
Students and families should anticipate substantial increases in the cost of higher education, with private institutions growing fastest, followed by out-of-state public tuition, and in-state public tuition growing at a comparatively moderate rate. Planning early for tuition inflation and exploring financial aid or scholarship opportunities will be increasingly important.
Projected tuition growth shows that four years of college in 2035 could cost approximately $81,116 at private universities, $61,031 for out-of-state public students, and $34,496 for in-state public students, helping prospective students gauge future affordability.
Conclusions
- By 2023, U.S. college education costs had escalated into one of the fastest-growing household expenses, with tuition at 4-year institutions rising from just $553 in 1963-64 to $17,709 today. This long-term surge highlights how higher education has shifted from a relatively affordable path to a major financial challenge for families.
- The burden is not uniform: public colleges remain far more affordable than private institutions, with 4-year private tuition averaging $35,248 compared to $9,750 at public universities. Yet even public colleges have seen tuition increase by more than 140% in the past two decades, reflecting shrinking state support and shifting costs onto students.
- Living arrangements strongly shape affordability. Students who live with family typically save over $10,000 annually compared with peers living on campus, underlining the critical role of housing in determining the total cost of attendance.
- Inflation-adjusted figures confirm that higher education has more than doubled in real cost since the late 1960s, growing far faster than wages and consumer inflation. This divergence has intensified concerns about access, debt, and the long-term value of a degree.
- Looking forward, tuition growth appears to have slowed slightly in recent years, but the decades-long upward trajectory suggests costs will remain a central policy and financial challenge. Without structural changes in funding and affordability, families can expect higher education to continue outpacing income growth.
Sources
- Average Total Cost of Attendance for First-Time, Full-Time Degree/Certificate-Seeking Undergraduate Students in Degree-Granting Postsecondary Institutions, by Control and Level of Institution, Living Arrangement, and Component of Student Costs: Selected Academic Years, 2010-11 through 2022-23. https://nces.ed.gov/programs/digest/d23/tables/dt23_330.40.asp. Accessed 26 August 2025.
- Average Undergraduate Tuition, Fees, Room, and Board Charges for Full-Time Students in Degree-Granting Postsecondary Institutions, by Control and Level of Institution and State: Academic Years 2021-22 and 2022-23. https://nces.ed.gov/programs/digest/d23/tables/dt23_330.20.asp. Accessed 26 August 2025.
- Average Undergraduate Tuition, Fees, Room, and Board Rates Charged for Full-Time Students in Degree-Granting Postsecondary Institutions, by Level and Control of Institution: Selected Academic Years, 1963-64 through 2022-23. https://nces.ed.gov/programs/digest/d23/tables/dt23_330.10.asp. Accessed 26 August 2025.
- “College Cost Projector.” Mefa.Org, https://www.mefa.org/article/college-cost-projector/. Accessed 26 August 2025.
- “Best National University Rankings.” USNews. https://www.usnews.com/best-colleges/rankings/national-universities?_sort=rank&_sortDirection=asc&_mode=table. Accessed 26 August 2025.

