Key findings:
The number of U.S. adults ages 25-64 with some college but no degree increased from 39.0 million in 2020 to 43.1 million in 2023, adding more than 4.1 million adults in just three years.
Year-over-year growth peaked above 3.5% in 2021-2022 before moderating to 2.9% in 2023, indicating continued expansion with slowing momentum.
Public two-year colleges account for the majority of the SCNC population, with 24.8 million adults in 2023, representing nearly 58% of all individuals with some college and no credential.
The SCNC population grew across every U.S. state between 2020 and 2023, with the largest absolute increases in California, Texas, and Florida.
Gender composition has remained stable over time, with men and women each representing roughly 45-46% of the SCNC population.
Racial composition shows growth across all major groups, with Hispanic adults increasing their share from 16.9% in 2020 to 18.5% in 2023, the fastest growth among large demographic groups.
Adults under age 35 make up the majority of those with some college and no credential, but more than 5.8 million adults aged 45-64 were in this category in 2023, highlighting its long-term nature.
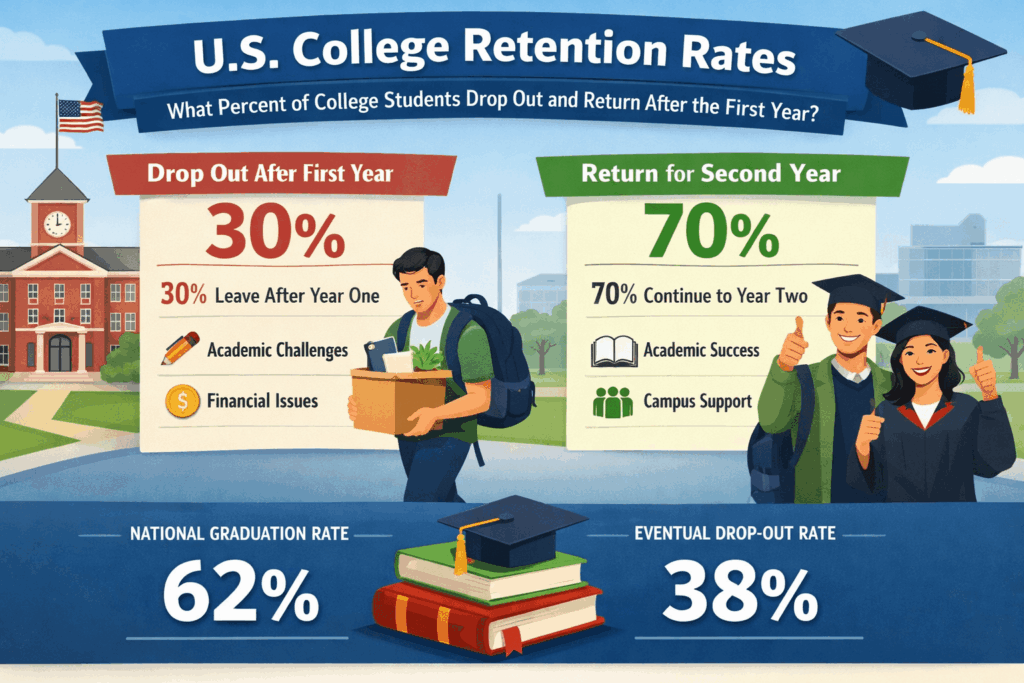
Re-enrollment rates for adults with some college but no degree remain low nationwide, typically between 2% and 3% annually, underscoring structural barriers to degree completion despite the growing population.
Millions of Americans start college with ambition but leave without a degree, creating a large population of adults with some college but no credentials. Understanding who these learners are, how they progress, and where gaps exist can reveal critical insights for education policy, workforce planning, and lifelong learning strategies. From state-level patterns to graduation outcomes by age, gender, and race, this article explores the trends, growth, and disparities shaping college completion in the United States. Whether you’re a journalist, policymaker, or curious reader, the data paints a clear picture of who returns, who stops out, and the factors influencing long-term success in higher education.
National population of adults with some college but no degree
Total number of Americans with some college but no degree
The chart shows the total number of Americans with some college but no degree over time, highlighting how this population has evolved in recent years. By presenting Americans with some college but no degree by year, the data provides a clear baseline for understanding broader Americans with some college but no degree trends and longer-term growth patterns.

- The number of Americans with some college but no degree increased from 39.0 million in 2020 to 43.1 million in 2023, a net rise of about 4.1 million adults.
- Between 2020 and 2021 alone, the SCNC population grew by approximately 1.4 million people, marking a sharp year-over-year increase.
- Growth continued each year through 2023, with the total rising by more than 3 million adults between 2021 and 2023, underscoring sustained growth in the number of Americans with some college but no degree.
Number of Americans with some college but no degree by year
These Americans with some college but no degree statistics indicate that the SCNC population is not static but steadily expanding. The consistent upward movement across all observed years reinforces long-term Americans with some college but no degree, suggesting structural rather than temporary factors behind the increase. Understanding the scale of this population is critical, as it frames subsequent discussions around re-enrollment, completion strategies, and the broader implications for higher education and workforce policy.
After establishing the overall size of the population, the next step is to examine how quickly the number of adults with some college but no credentials has been growing year over year.
Growth in the number of adults with some college but no credentials
The chart illustrates the growth rate of adults with some college but no credentials over recent years. By focusing on annual percentage change, it highlights how the pace of expansion has shifted even as the total population continued to increase.

- In 2021, the number of adults with some college but no credentials grew by 3.57%, marking the highest annual growth rate shown.
- Growth remained nearly unchanged in 2022 at 3.58%, indicating sustained momentum year over year.
- By 2023, the growth rate slowed to 2.91%, signaling a deceleration despite continued expansion.
Year-over-year growth of adults with some college but no credentials
The data shows that while the population of adults with some college but no credentials continues to grow, the rate of growth has begun to moderate. Following two consecutive years of growth above 3.5%, the decline to under 3% in 2023 suggests a shift in dynamics rather than a reversal. This slowing growth rate provides important context for evaluating future projections and policy responses related to re-enrollment, completion pathways, and adult learner engagement.
While overall growth rates show how quickly this population is expanding, understanding where adults with some college but no credentials last enrolled provides critical insight into how different parts of the higher education system contribute to this group.
Adults with some college, no credentials by the last sector of enrollment
The chart breaks down adults with some college, no credentials by last sector of enrollment, showing both headcounts and percentage shares over time. By comparing sectors across multiple years, the data highlights how the composition of this population varies between public, private, and online institutions.

- Public 2-year institutions accounted for the largest share, with 24.8 million adults in 2023, representing 57.6% of all adults with some college but no credentials.
- The number of adults last enrolled in public 4-year institutions rose from 6.1 million in 2020 to 7.0 million in 2023, increasing their share from 15.5% to 16.3%.
- Primarily online institutions grew steadily, with enrollment-linked SCNC adults increasing from 1.77 million (4.5%) in 2020 to 2.07 million (4.8%) in 2023.
Where adults with some college, no credentials, last enrolled
| Sector | Year | Persons | Share, % |
| Public 4yr | 2020 | 6,066,403 | 15.5% |
| 2021 | 6,451,429 | 16.0% | |
| 2022 | 6,738,793 | 16.1% | |
| 2023 | 7,012,717 | 16.3% | |
| Private nonprofit 4yr | 2020 | 2,672,819 | 6.8% |
| 2021 | 2,758,362 | 6.8% | |
| 2022 | 2,882,027 | 6.9% | |
| 2023 | 2,952,999 | 6.9% | |
| Private for-profit 4yr | 2020 | 597,714 | 1.5% |
| 2021 | 660,171 | 1.6% | |
| 2022 | 761,304 | 1.8% | |
| 2023 | 823,644 | 1.9% | |
| PAB | 2020 | 4,764,536 | 12.2% |
| 2021 | 4,719,894 | 11.7% | |
| 2022 | 4,694,520 | 11.2% | |
| 2023 | 4,835,704 | 11.2% | |
| Public 2yr | 2020 | 22,747,105 | 58.3% |
| 2021 | 23,579,489 | 58.3% | |
| 2022 | 24,280,171 | 58.0% | |
| 2023 | 24,832,764 | 57.6% | |
| Primarily online | 2020 | 1,770,015 | 4.5% |
| 2021 | 1,858,790 | 4.6% | |
| 2022 | 1,970,312 | 4.7% | |
| 2023 | 2,073,650 | 4.8% |
These data show that the population of adults with some college but no credentials is heavily concentrated among those who last attended public 2-year colleges, underscoring the central role of the community college sector. At the same time, gradual increases in the shares associated with public 4-year and primarily online institutions indicate a broadening institutional footprint. Together, these patterns suggest that efforts to re-engage adults with some college but no credentials must account for sector-specific dynamics rather than relying on a single institutional strategy.
After examining how adults with some college but no credentials are distributed across higher education sectors, the analysis now turns to how this population is spread geographically across U.S. states.
State-by-state overview of SCNC adults and potential degree completers
Some college no credentials by the state
The chart presents SCNC statistics by state, showing the number of adults with some college but no credentials from 2020 through 2023. By comparing states over time, the data provides important context alongside broader indicators such as higher education attainment by state, dropout rates by state, and the evolving enrollment cliff by state.
- California had the largest population of adults with some college but no credentials, increasing from 6.36 million in 2020 to 7.07 million in 2023, an absolute rise of more than 700,000 adults.
- Texas followed a similar upward trajectory, with the SCNC population growing from 2.50 million in 2020 to 2.83 million in 2023, an increase of roughly 330,000 adults.
- Among mid-sized states, Florida saw consistent growth, rising from 1.60 million adults in 2020 to 1.79 million in 2023, reflecting steady year-over-year expansion.
SCNC statistics by state: adults with some college, no credentials
| State | SCNC (2020), persons | SCNC (2021), persons | SCNC (2022), persons | SCNC (2023), persons |
| Alabama | 450,300 | 469,488 | 486,986 | 500,669 |
| Alaska | 117,912 | 121,035 | 122,972 | 125,161 |
| Arizona | 681,252 | 726,293 | 771,299 | 811,150 |
| Arkansas | 304,513 | 314,843 | 323,989 | 330,745 |
| California | 6,360,375 | 6,612,278 | 6,875,620 | 7,066,226 |
| Colorado | 707,584 | 726,076 | 747,726 | 767,069 |
| Connecticut | 373,312 | 384,799 | 398,236 | 406,718 |
| D.C. | 36,575 | 38,618 | 40,373 | 41,911 |
| Delaware | 63,522 | 68,540 | 73,785 | 78,250 |
| Florida | 1,596,975 | 1,661,306 | 1,731,032 | 1,791,304 |
| Georgia | 744,495 | 773,228 | 805,839 | 835,362 |
| Hawaii | 96,224 | 99,625 | 103,391 | 107,393 |
| Idaho | 181,897 | 190,536 | 199,536 | 210,224 |
| Illinois | 1,892,039 | 1,942,815 | 1,987,689 | 2,030,908 |
| Indiana | 745,358 | 769,286 | 794,399 | 812,661 |
| Iowa | 374,653 | 386,692 | 398,264 | 407,603 |
| Kansas | 381,941 | 398,413 | 413,403 | 425,581 |
| Kentucky | 592,803 | 611,023 | 627,180 | 640,782 |
| Louisiana | 462,882 | 478,853 | 496,443 | 511,095 |
| Maine | 132,459 | 137,281 | 143,166 | 148,717 |
| Maryland | 613,138 | 635,665 | 661,178 | 680,815 |
| Massachusetts | 695,898 | 719,985 | 744,130 | 766,425 |
| Michigan | 1,127,317 | 1,159,852 | 1,190,601 | 1,229,211 |
| Minnesota | 594,996 | 612,294 | 629,497 | 647,685 |
| Mississippi | 316,491 | 328,330 | 341,249 | 349,410 |
| Missouri | 655,908 | 678,566 | 699,157 | 758,438 |
| Montana | 110,090 | 113,914 | 117,854 | 121,123 |
| Nebraska | 307,345 | 315,301 | 322,425 | 329,685 |
| Nevada | 371,384 | 383,036 | 394,841 | 404,999 |
| New Hampshire | 99,823 | 102,777 | 106,102 | 108,951 |
| New Jersey | 766,459 | 792,527 | 819,264 | 840,502 |
| New Mexico | 291,443 | 301,215 | 311,079 | 316,984 |
| New York | 1,948,109 | 2,011,385 | 2,078,394 | 2,136,652 |
| North Carolina | 1,080,138 | 1,109,025 | 1,139,715 | 1,167,532 |
| North Dakota | 72,725 | 75,358 | 78,343 | 80,780 |
| Ohio | 1,363,710 | 1,398,230 | 1,435,371 | 1,467,990 |
| Oklahoma | 403,289 | 418,509 | 434,825 | 447,333 |
| Oregon | 773,080 | 791,143 | 810,344 | 825,313 |
| Pennsylvania | 1,087,555 | 1,121,313 | 1,153,948 | 1,190,108 |
| Rhode Island | 125,883 | 129,361 | 135,349 | 138,536 |
| South Carolina | 472,043 | 487,205 | 503,476 | 515,694 |
| South Dakota | 67,022 | 69,787 | 72,773 | 75,301 |
| Tennessee | 612,326 | 635,828 | 659,990 | 679,802 |
| Texas | 2,501,802 | 2,614,007 | 2,728,589 | 2,832,320 |
| Utah | 386,318 | 400,221 | 414,987 | 432,319 |
| Vermont | 64,723 | 66,956 | 69,005 | 74,549 |
| Virginia | 924,765 | 954,052 | 983,277 | 1,058,458 |
| Washington | 1,124,642 | 1,160,584 | 1,195,938 | 1,225,573 |
| West Virginia | 185,449 | 192,168 | 197,889 | 202,601 |
| Wisconsin | 721,678 | 744,153 | 761,681 | 779,221 |
| Wyoming | 94,687 | 97,491 | 99,652 | 104,459 |
These data highlight substantial variation in the size of the SCNC population across states, driven largely by overall population scale and higher education participation patterns. Large states account for the highest absolute numbers, but nearly every state shows consistent growth over the four years, reinforcing the national scope of the issue. Viewed alongside measures such as the percent of adults with college degrees by state and the immediate college enrollment rate by state, the distribution of adults with some college but no credentials underscores the importance of state-level strategies when addressing attainment gaps and enrollment challenges.
While state-level data shows where adults with some college but no credentials are concentrated geographically, examining gender composition helps clarify who makes up this population nationally.
Demographic breakdown of adults with some college experience
Some college no credentials by gender
The chart shows the gender distribution of adults with some college, no credentials, over time, broken down into male, female, and unknown or missing categories. This view provides demographic context that complements broader measures such as the percentage of American adults with college degrees and the percentage of us adults with college degrees.

- In 2023, female adults accounted for 45.7% of adults with some college no credentials, slightly exceeding the 45.3% share for males.
- The male share remained highly stable, increasing marginally from 45.2% in 2020 to 45.3% in 2023.
- The unknown or missing gender category rose steadily from 8.7% in 2020 to 9.0% in 2023, indicating a small but consistent increase in unclassified records.
Gender distribution of adults with some college, no credentials
The gender distribution of adults with some college, no credentials has remained remarkably stable over the four years, with near parity between men and women. Small shifts over time suggest that growth in this population has been broadly balanced across genders rather than driven by one group. Placed alongside benchmarks such as the number of adults with college degrees and the percentage of us citizens who have a college degree, these data indicate that gender differences play a limited role in explaining changes in the overall size of the SCNC population.
Beyond gender patterns, examining racial composition provides additional insight into which communities are most represented among adults with some college but no credentials.
Some college, no credentials by race
The chart breaks down adults with some college, no credentials by race, showing both absolute counts and percentage shares from 2020 to 2023. By tracking changes over time, the data highlights how the racial makeup of this population has shifted as overall numbers increased.

- White adults remained the largest identified racial group, increasing from 2.38 million (33.1%) in 2020 to 3.72 million (33.4%) in 2023.
- The Hispanic population grew steadily, rising from 1.22 million (16.9%) in 2020 to 2.06 million (18.5%) in 2023, representing the largest share increase among major groups.
- The unknown or missing race category declined in share from 27.0% in 2020 to 24.8% in 2023, even as the number of individuals increased from 1.94 million to 2.77 million.
Racial composition of adults with some college, no credentials
| Race | Year | Persons | Share, % |
| White | 2020 | 2,376,992 | 33.1% |
| 2021 | 2,858,687 | 33.4% | |
| 2022 | 3,275,094 | 32.9% | |
| 2023 | 3,724,030 | 33.4% | |
| Hispanic | 2020 | 1,216,799 | 16.9% |
| 2021 | 1,501,403 | 17.5% | |
| 2022 | 1,778,489 | 17.9% | |
| 2023 | 2,060,558 | 18.5% | |
| Black | 2020 | 1,028,966 | 14.3% |
| 2021 | 1,236,865 | 14.4% | |
| 2022 | 1,403,727 | 14.1% | |
| 2023 | 1,575,371 | 14.1% | |
| Asian | 2020 | 177,109 | 2.5% |
| 2021 | 219,684 | 2.6% | |
| 2022 | 262,872 | 2.6% | |
| 2023 | 302,477 | 2.7% | |
| Native American | 2020 | 75,829 | 1.1% |
| 2021 | 90,639 | 1.1% | |
| 2022 | 103,563 | 1.0% | |
| 2023 | 116,133 | 1.0% | |
| Pacific Islander | 2020 | 25,359 | 0.4% |
| 2021 | 30,512 | 0.4% | |
| 2022 | 36,125 | 0.4% | |
| 2023 | 40,909 | 0.4% | |
| Other | 2020 | 350,648 | 4.9% |
| 2021 | 427,788 | 5.0% | |
| 2022 | 503,454 | 5.1% | |
| 2023 | 570,326 | 5.1% | |
| Unknown/missing | 2020 | 1,940,098 | 27.0% |
| 2021 | 2,194,378 | 25.6% | |
| 2022 | 2,597,070 | 26.1% | |
| 2023 | 2,769,974 | 24.8% |
These data show that growth in the SCNC population has occurred across all major racial groups rather than being concentrated in a single segment. At the same time, differences in growth rates have gradually reshaped the overall composition, with Hispanic adults accounting for a growing share of the total. The declining proportional share of unknown or missing race suggests incremental improvements in data coverage, which is important for accurately assessing disparities and targeting policy responses.
After examining racial composition, the next dimension to consider is age, which helps clarify when individuals with some college but no credentials most recently engaged with higher education.
Some college, no credentials bythe age of last enrollment
The chart shows adults with some college, no credentials, by age of last enrollment, combining both population counts and percentage shares over time. By tracking age groups from recent enrollees to older adults, the data illustrates how this population is distributed across different life stages.
, 20 to 24 (%), 25 to 34 (%), 35 to 44 (%), 45 to 64 (%)…")
- Adults aged 20 to 24 consistently represented the largest group, increasing from 10.86 million (27.8%) in 2020 to 12.03 million (27.9%) in 2023.
- The 18 to 19-year-old age group grew from 6.18 million in 2020 to 7.20 million in 2023, raising its share from 15.8% to 16.7%.
- Adults aged 45 to 64 increased in number from 5.49 million to 5.82 million between 2020 and 2023, even as their share declined slightly from 14.1% to 13.5%.
Age distribution of adults with some college, no credentials
| Age | Year | Persons | Share, % |
| 18 to 19 | 2020 | 6,178,718 | 15.8% |
| 2021 | 6,523,680 | 16.1% | |
| 2022 | 6,921,014 | 16.5% | |
| 2023 | 7,201,858 | 16.7% | |
| 20 to 24 | 2020 | 10,861,391 | 27.8% |
| 2021 | 11,256,239 | 27.8% | |
| 2022 | 11,677,907 | 27.9% | |
| 2023 | 12,025,871 | 27.9% | |
| 25 to 34 | 2020 | 8,949,412 | 22.9% |
| 2021 | 9,204,256 | 22.8% | |
| 2022 | 9,469,731 | 22.6% | |
| 2023 | 9,721,787 | 22.6% | |
| 35 to 44 | 2020 | 5,360,044 | 13.7% |
| 2021 | 5,485,382 | 13.6% | |
| 2022 | 5,607,453 | 13.4% | |
| 2023 | 5,733,053 | 13.3% | |
| 45 to 64 | 2020 | 5,488,106 | 14.1% |
| 2021 | 5,614,698 | 13.9% | |
| 2022 | 5,721,508 | 13.7% | |
| 2023 | 5,820,686 | 13.5% | |
| Over 65 | 2020 | 716,059 | 1.8% |
| 2021 | 742,438 | 1.8% | |
| 2022 | 764,882 | 1.8% | |
| 2023 | 780,182 | 1.8% | |
| Unknown/Missing | 2020 | 1,486,369 | 3.8% |
| 2021 | 1,605,419 | 4.0% | |
| 2022 | 1,718,990 | 4.1% | |
| 2023 | 1,815,383 | 4.2% |
These data indicate that adults with some college but no credentials are concentrated primarily among younger age groups, particularly those under 35 at the time of last enrollment. At the same time, substantial numbers of individuals appear across all age ranges, including more than 5.8 million adults aged 45 to 64 in 2023. The presence of both recent enrollees and older adults underscores that some college no credentials is not solely a short-term outcome but often a long-term status spanning multiple stages of adulthood.
While overall growth in the population with some college but no credentials highlights the scale of the challenge, the next critical question is how many of these learners actually return to higher education.
Re-enrollment trends for SCNC adults across states
Re-enrollment rate for adults with some college but no degree across U.S. states
This chart examines the re-enrollment rate for adults with some college but no degree across U.S. states over three academic years, from AY 2021-22 to AY 2023-24. The data highlights meaningful variation in the percentage of SCNC learners who re-enroll, reflecting differences in state policies, outreach strategies, and learner support structures.
- In AY 2023-24, the percentage of SCNC learners who re-enroll ranged from 1.8% in Oregon to 4.0% in Utah, indicating more than a twofold gap across states.
- Several states showed steady gains over time, including Maryland, where the re-enrollment rate for adults with some college but no degree increased from 3.4% in AY 2021-22 to 3.9% in AY 2023-24.
- Looking specifically at the re-enrollment rate for adults with some college but no degree in 2022, values clustered tightly, with many large states such as California and Florida reporting rates between 2.6% and 2.7%.
Percentage of SCNC learners who re-enroll: state-level trends since 2021
| State | AY 2021-22, % | AY 2022-23, % | AY 2023-24, % |
| Alabama | 2.8% | 2.8% | 2.9% |
| Alaska | 2.5% | 2.4% | 2.5% |
| Arizona | 3.6% | 3.8% | 3.9% |
| Arkansas | 2.5% | 2.6% | 2.6% |
| California | 2.4% | 2.7% | 2.9% |
| Colorado | 2.1% | 2.2% | 2.3% |
| Connecticut | 1.8% | 2.0% | 1.9% |
| District of Columbia | 2.4% | 2.6% | 2.7% |
| Delaware | 3.0% | 3.3% | 3.5% |
| Florida | 2.6% | 2.6% | 2.8% |
| Georgia | 2.9% | 3.0% | 3.3% |
| Hawaii | 2.7% | 2.7% | 2.7% |
| Idaho | 3.2% | 3.2% | 3.5% |
| Illinois | 1.8% | 1.9% | 2.0% |
| Indiana | 2.1% | 2.3% | 2.4% |
| Iowa | 1.8% | 1.9% | 1.9% |
| Kansas | 2.6% | 2.6% | 2.7% |
| Kentucky | 2.3% | 2.5% | 2.5% |
| Louisiana | 2.5% | 2.8% | 2.7% |
| Maine | 2.0% | 2.3% | 2.3% |
| Maryland | 3.4% | 3.6% | 3.9% |
| Massachusetts | 2.0% | 2.1% | 2.5% |
| Michigan | 2.4% | 2.2% | 2.4% |
| Minnesota | 1.9% | 1.8% | 1.9% |
| Mississippi | 2.4% | 2.6% | 2.8% |
| Missouri | 2.1% | 2.2% | 2.3% |
| Montana | 2.2% | 2.1% | 2.1% |
| Nebraska | 2.1% | 2.1% | 2.2% |
| Nevada | 2.1% | 2.2% | 2.2% |
| New Hampshire | 2.2% | 2.2% | 2.2% |
| New Jersey | 2.1% | 2.2% | 2.3% |
| New Mexico | 2.8% | 3.1% | 2.9% |
| New York | 2.0% | 2.1% | 2.2% |
| North Carolina | 2.6% | 2.6% | 2.7% |
| North Dakota | 2.4% | 2.3% | 2.1% |
| Ohio | 1.9% | 2.0% | 2.1% |
| Oklahoma | 2.7% | 2.9% | 2.6% |
| Oregon | 1.7% | 1.8% | 1.8% |
| Pennsylvania | 1.9% | 1.9% | 2.0% |
| Rhode Island | 2.1% | 2.4% | 2.6% |
| South Carolina | 2.7% | 2.9% | 2.9% |
| South Dakota | 2.1% | 2.2% | 2.3% |
| Tennessee | 2.2% | 2.3% | 2.3% |
| Texas | 3.1% | 3.0% | 3.1% |
| Utah | 3.7% | 3.5% | 4.0% |
| Vermont | 2.7% | 2.5% | 2.6% |
| Virginia | 2.5% | 2.5% | 2.7% |
| Washington | 1.9% | 1.9% | 2.0% |
| West Virginia | 2.1% | 2.3% | 2.2% |
| Wisconsin | 2.2% | 2.2% | 2.3% |
| Wyoming | 2.3% | 2.3% | 2.1% |
Overall, re-enrollment among SCNC learners remains relatively low nationwide, with most states reporting rates between 2% and 3% even in the most recent academic year. The limited upward movement in the percentage of scnc learners who re enroll 2022 and beyond suggests that systemic barriers, often overlapping with factors tied to the dropout rate for first-generation college students, continue to constrain re-entry into higher education. Without targeted, scalable interventions, these modest re-enrollment levels are unlikely to offset the growing population of adults with some college but no degree.
After examining re-enrollment dynamics among learners with some college but no credential, it is equally important to assess long-term completion outcomes within traditional four-year degree pathways.
Graduation rates in U.S. four-year colleges
Graduation in 4-year programs total
This chart presents college graduation rates by year for students entering four-year programs, tracking completion within four, five, and six years. The data provides context for understanding the average graduation rate for 4-year college programs and how extended time-to-degree affects overall completion outcomes.

- For students entering in 1996, the six-year graduation rate was 55.4%, compared with 64.5% for the 2017 cohort, reflecting a 9.1 percentage point increase over time.
- The share of students graduating within four years rose steadily, from 33.7% in 1996 to 49.1% for the 2016 and 2017 cohorts, narrowing the gap between on-time and extended completion.
- Among recent cohorts, what percentage of college students graduate in 6 years consistently exceeded 64%, with the peak reaching 64.6% for students entering in 2015 and 2016.
College graduation rates by year in four-year programs
| Year of entry | Within 4 years, % | Within 5 years, % | Within 6 years, % |
| 1996 | 33.7% | 50.2% | 55.4% |
| 2000 | 36.1% | 52.6% | 57.6% |
| 2002 | 36.6% | 52.6% | 57.4% |
| 2003 | 37.0% | 53.2% | 57.8% |
| 2004 | 38.0% | 54.1% | 58.4% |
| 2005 | 38.3% | 54.2% | 58.6% |
| 2006 | 39.1% | 54.9% | 59.2% |
| 2007 | 39.4% | 55.1% | 59.4% |
| 2008 | 39.8% | 55.4% | 59.6% |
| 2009 | 39.9% | 55.3% | 59.4% |
| 2010 | 40.7% | 55.8% | 59.7% |
| 2011 | 41.6% | 56.6% | 60.4% |
| 2012 | 43.7% | 58.7% | 62.4% |
| 2013 | 45.3% | 59.9% | 63.4% |
| 2014 | 46.6% | 60.6% | 64.0% |
| 2015 | 47.7% | 61.4% | 64.6% |
| 2016 | 49.1% | 61.8% | 64.6% |
| 2017 | 49.1% | 61.7% | 64.5% |
Overall, the six-year graduation rate of four-year colleges has shown sustained improvement across successive cohorts, indicating stronger student persistence and institutional support. The upward movement in four-, five-, and six-year completion underscores positive six-year graduation rate trends, even as a significant share of students continue to rely on extended timeframes to earn a degree. Despite these gains, the data suggests that accelerating time-to-degree remains a key lever for further improving the average graduation rate for 4 year college programs nationwide.
While overall graduation rates in four-year programs have improved over time, a closer look by gender reveals persistent differences in how quickly and consistently students complete their degrees.
Graduation outcomes in four-year programs by gender
This chart breaks down graduation outcomes in four-year programs by gender, tracking completion within four, five, and six years across multiple entry cohorts. The data highlights how male and female students progress differently through degree timelines, offering deeper insight into long-term completion patterns.

- For the 2017 entry cohort, the six-year graduation rate reached 67.5% for female students, compared with 60.9% for male students, a 6.6 percentage point gap.
- Female students consistently outperformed male students in four-year completion, rising from 38.0% in 1996 to 53.8% in 2017, while male four-year graduation increased from 28.5% to 43.4% over the same period.
- The gender gap in six-year completion widened slightly over time, growing from 6.2 percentage points in 1996 (58.2% female vs. 52.0% male) to 6.6 percentage points in 2017.
Gender gaps in four-year college graduation rates
| Year of entry | Male within 4 years, % | Male within 5 years, % | Male within 6 years, % | Female within 4 years, % | Female within 5 years, % | Female within 6 years, % |
| 1996 | 28.5% | 46.2% | 52.0% | 38.0% | 53.6% | 58.2% |
| 2000 | 31.1% | 49.0% | 54.3% | 40.1% | 55.6% | 60.2% |
| 2002 | 31.4% | 49.0% | 54.4% | 40.8% | 55.6% | 59.9% |
| 2003 | 32.2% | 49.9% | 55.1% | 41.0% | 55.9% | 60.0% |
| 2004 | 33.0% | 50.6% | 55.6% | 42.2% | 56.9% | 60.7% |
| 2005 | 33.5% | 50.9% | 56.0% | 42.2% | 56.8% | 60.8% |
| 2006 | 34.3% | 51.6% | 56.5% | 43.1% | 57.6% | 61.4% |
| 2007 | 34.5% | 51.6% | 56.5% | 43.5% | 58.1% | 61.9% |
| 2008 | 34.8% | 51.6% | 56.5% | 44.0% | 58.5% | 62.3% |
| 2009 | 34.7% | 51.5% | 56.2% | 44.2% | 58.4% | 62.1% |
| 2010 | 35.6% | 52.1% | 56.5% | 45.1% | 58.9% | 62.3% |
| 2011 | 36.5% | 52.9% | 57.3% | 45.9% | 59.7% | 63.0% |
| 2012 | 38.2% | 54.7% | 59.0% | 48.4% | 62.0% | 65.3% |
| 2013 | 39.7% | 55.9% | 59.9% | 50.0% | 63.3% | 66.3% |
| 2014 | 41.0% | 56.5% | 60.5% | 51.3% | 64.0% | 67.0% |
| 2015 | 42.2% | 57.5% | 61.2% | 52.3% | 64.7% | 67.4% |
| 2016 | 43.4% | 57.7% | 61.1% | 53.7% | 65.1% | 67.5% |
| 2017 | 43.4% | 57.5% | 60.9% | 53.8% | 65.0% | 67.5% |
Across all cohorts, female students demonstrate higher graduation rates than male students within four-, five-, and six-year timeframes. Although both genders show steady improvement in degree completion since the late 1990s, the persistent gap suggests structural or behavioral differences affecting student persistence. Overall, the data indicate that closing the gender gap remains a critical factor for improving aggregate graduation outcomes in four-year programs.
Examining overall graduation trends by gender highlights one dimension of disparity, but completion outcomes also vary substantially across racial and ethnic groups.
Four-year graduation rates by race in U.S. colleges
This chart displays graduation within 4 years in 4-year programs by race, showing the percentage of students completing their degrees on time across multiple entry cohorts. The data illustrate significant differences in on-time graduation rates among racial groups, reflecting systemic challenges and inequities within higher education.

- For the 2017 cohort, Asian students had the highest four-year graduation rate at 60.9%, compared with 28.6% for American Indian/Alaska Native students, highlighting a more than twofold disparity.
- Hispanic students increased their four-year graduation rate from 22.8% in 1996 to 40.8% in 2017, showing consistent improvement over two decades.
- White students maintained a strong on-time completion rate, rising from 41.7% in 1996 to 53.6% in 2017, while Black students reached 29.8% in 2017, indicating persistent racial gaps.
Race-based differences in on-time graduation for four-year programs
| Year of entry | American Indian/Alaska Native, % | Asian, % | Black, % | Hispanic, % | Pacific Islander, % | White, % | Two or more races, % | Nonresident, % |
| 1996 | 18.8% | 19.5% | 22.8% | 36.3% | 41.7% | |||
| 2000 | 21.0% | 21.2% | 25.8% | 38.9% | 41.9% | |||
| 2002 | 20.6% | 20.5% | 26.6% | 39.6% | 39.1% | |||
| 2003 | 20.6% | 20.2% | 26.7% | 40.2% | 39.4% | |||
| 2004 | 21.8% | 20.5% | 27.9% | 41.3% | 43.7% | |||
| 2005 | 21.8% | 45.5% | 20.2% | 28.2% | 22.2% | 41.8% | 44.1% | 44.0% |
| 2006 | 21.9% | 46.4% | 20.6% | 29.3% | 24.2% | 42.7% | 46.6% | 44.1% |
| 2007 | 23.0% | 46.7% | 20.8% | 29.8% | 25.9% | 43.3% | 49.1% | 44.6% |
| 2008 | 23.0% | 47.7% | 21.4% | 30.4% | 26.7% | 43.7% | 46.5% | 46.4% |
| 2009 | 24.0% | 49.5% | 20.6% | 30.7% | 26.7% | 44.2% | 41.0% | 49.1% |
| 2010 | 22.7% | 50.2% | 21.2% | 31.7% | 31.0% | 45.4% | 39.6% | 50.1% |
| 2011 | 21.6% | 50.7% | 21.6% | 32.5% | 31.0% | 46.4% | 38.3% | 50.8% |
| 2012 | 24.5% | 52.6% | 23.8% | 34.1% | 31.6% | 48.3% | 39.3% | 51.9% |
| 2013 | 26.2% | 54.0% | 25.7% | 35.7% | 33.9% | 49.8% | 41.0% | 52.8% |
| 2014 | 27.1% | 55.9% | 27.2% | 37.4% | 34.4% | 51.2% | 42.6% | 53.5% |
| 2015 | 28.3% | 57.5% | 28.2% | 38.4% | 35.8% | 52.4% | 43.4% | 55.1% |
| 2016 | 28.7% | 60.0% | 29.7% | 40.4% | 36.0% | 53.6% | 44.7% | 56.6% |
| 2017 | 28.6% | 60.9% | 29.8% | 40.8% | 35.1% | 53.6% | 45.0% | 56.5% |
Overall, graduation within four years in four-year programs varies significantly by race, with Asian and White students consistently achieving higher rates than Black, Hispanic, and American Indian/Alaska Native students. Although all groups have shown improvement over time, the data reveal persistent disparities that likely reflect differences in access to resources, institutional support, and socio-economic factors. Addressing these gaps is critical for promoting equity and improving overall graduation outcomes in U.S. higher education.
While four-year graduation rates highlight on-time completion, examining five-year outcomes provides a fuller picture of student persistence across racial groups.
Five-year graduation outcomes by race in four-year programs
This chart presents graduation within 5 years in 4-year programs by race, showing the percentage of students completing their degrees within an extended timeline. The data illustrate that although additional time improves completion rates for all groups, significant racial disparities remain across cohorts.

- For the 2017 entry cohort, Asian students had the highest five-year graduation rate at 75.1%, compared with 38.1% for American Indian/Alaska Native students, showing a 37 percentage point gap.
- White students reached a five-year graduation rate of 65.7% in 2017, while Black students completed at 42.0%, reflecting persistent disparities over time.
- Hispanic students improved from 38.9% in 1996 to 54.8% in 2017, demonstrating steady gains in five-year completion rates.
Race disparities in five-year college completion rates
| Year of entry | American Indian/Alaska Native, % | Asian, % | Black, % | Hispanic, % | Pacific Islander, % | White, % | Two or more races, % | Nonresident, % |
| 1996 | 33.3% | 33.3% | 38.9% | 53.3% | 54.3% | |||
| 2000 | 35.1% | 36.0% | 42.4% | 55.7% | 55.2% | |||
| 2002 | 34.0% | 34.4% | 42.7% | 56.0% | 51.0% | |||
| 2003 | 33.7% | 34.2% | 43.0% | 56.9% | 52.1% | |||
| 2004 | 34.7% | 34.5% | 44.0% | 57.7% | 57.2% | |||
| 2005 | 34.7% | 63.6% | 34.2% | 44.6% | 40.6% | 58.0% | 58.6% | 58.1% |
| 2006 | 35.6% | 64.9% | 34.9% | 45.8% | 41.7% | 58.7% | 61.8% | 59.0% |
| 2007 | 36.3% | 64.7% | 35.4% | 46.4% | 42.7% | 59.1% | 63.9% | 58.9% |
| 2008 | 36.3% | 65.7% | 35.7% | 47.1% | 43.7% | 59.5% | 60.6% | 60.9% |
| 2009 | 36.9% | 67.7% | 34.3% | 47.6% | 42.2% | 59.7% | 54.8% | 64.0% |
| 2010 | 34.6% | 68.1% | 34.7% | 48.8% | 46.5% | 60.4% | 55.2% | 65.4% |
| 2011 | 33.9% | 68.9% | 35.4% | 49.4% | 44.3% | 61.1% | 53.1% | 66.2% |
| 2012 | 36.2% | 70.5% | 37.9% | 51.4% | 45.6% | 62.8% | 53.9% | 67.2% |
| 2013 | 37.5% | 71.5% | 40.2% | 52.7% | 49.1% | 63.8% | 55.6% | 68.2% |
| 2014 | 38.4% | 72.5% | 41.0% | 53.8% | 48.5% | 64.5% | 55.8% | 67.9% |
| 2015 | 40.0% | 73.8% | 41.9% | 54.6% | 49.5% | 65.3% | 56.8% | 69.3% |
| 2016 | 39.7% | 74.7% | 42.5% | 55.3% | 48.1% | 65.6% | 57.4% | 69.9% |
| 2017 | 38.1% | 75.1% | 42.0% | 54.8% | 47.3% | 65.7% | 57.4% | 70.2% |
Graduation within five years shows higher completion rates than four-year outcomes for all racial groups, but substantial gaps persist between Asian and White students compared with American Indian/Alaska Native, Black, and Hispanic students. Over time, all groups show gradual improvement, indicating that extended timelines can help more students finish their degrees. Addressing systemic barriers remains essential to closing racial disparities and ensuring equitable graduation outcomes in U.S. four-year programs.
Building on five-year graduation outcomes, six-year completion rates provide a more comprehensive view of degree attainment across racial groups.
Six-year graduation rates by race in four-year programs
This chart presents graduation within 6 years in 4-year programs by race, highlighting the percentage of students completing their degrees over an extended timeline. The data demonstrates both improvements over time and persistent disparities between racial groups.

- For the 2017 entry cohort, Asian students had the highest six-year graduation rate at 78.3%, compared with 41.3% for American Indian/Alaska Native students, indicating a 37 percentage point gap.
- White students reached a six-year graduation rate of 68.1% in 2017, while Black students completed at 45.4%, showing ongoing disparities in long-term completion.
- Hispanic students increased from 45.7% in 1996 to 58.6% in 2017, reflecting steady improvement in six-year graduation outcomes.
Long-term college completion by race: Six-year outcomes
| Year of entry | American Indian/Alaska Native, % | Asian, % | Black, % | Hispanic, % | Pacific Islander, % | White, % | Two or more races, % | Nonresident, % |
| 1996 | 38.0% | 38.9% | 45.7% | 58.1% | 58.0% | |||
| 2000 | 40.2% | 42.1% | 49.1% | 60.2% | 59.6% | |||
| 2002 | 38.4% | 40.2% | 49.0% | 60.4% | 55.4% | |||
| 2003 | 38.7% | 39.5% | 49.1% | 61.1% | 56.1% | |||
| 2004 | 39.4% | 39.6% | 50.2% | 61.6% | 61.6% | |||
| 2005 | 39.3% | 69.6% | 39.5% | 51.0% | 48.3% | 62.0% | 64.2% | 62.6% |
| 2006 | 40.2% | 70.6% | 40.2% | 51.9% | 48.5% | 62.5% | 66.6% | 63.6% |
| 2007 | 40.6% | 70.5% | 40.7% | 52.5% | 49.5% | 62.9% | 67.8% | 63.9% |
| 2008 | 41.0% | 71.2% | 40.9% | 53.5% | 49.9% | 63.2% | 65.2% | 65.7% |
| 2009 | 41.2% | 73.0% | 39.5% | 53.6% | 48.5% | 63.3% | 59.2% | 68.8% |
| 2010 | 38.5% | 73.5% | 39.3% | 54.3% | 50.9% | 63.7% | 59.4% | 70.0% |
| 2011 | 37.7% | 74.1% | 39.8% | 55.0% | 48.8% | 64.4% | 57.1% | 71.0% |
| 2012 | 40.6% | 75.5% | 42.4% | 56.7% | 49.0% | 65.9% | 57.7% | 71.5% |
| 2013 | 40.8% | 76.1% | 44.3% | 57.9% | 53.4% | 66.7% | 59.3% | 72.3% |
| 2014 | 41.5% | 77.0% | 45.0% | 58.7% | 52.3% | 67.4% | 59.5% | 72.1% |
| 2015 | 43.4% | 77.8% | 45.7% | 59.2% | 53.5% | 67.9% | 60.1% | 72.6% |
| 2016 | 42.6% | 78.0% | 45.9% | 59.3% | 51.6% | 68.0% | 60.5% | 72.9% |
| 2017 | 41.3% | 78.3% | 45.4% | 58.6% | 50.5% | 68.1% | 60.5% | 73.5% |
Six-year graduation rates show that extended time significantly increases completion for all racial groups, particularly for students from historically underrepresented backgrounds. Despite gains over time, disparities remain pronounced between Asian and White students compared with American Indian/Alaska Native, Black, and Hispanic students. Efforts to support degree completion must continue to address systemic barriers, ensuring equitable long-term outcomes for all racial groups in U.S. four-year programs.
Conclusions
The population of Americans with some college but no degree has expanded steadily since 2020, reflecting structural challenges in college completion rather than short-term disruptions tied solely to the pandemic. The consistent growth across multiple years suggests that stop-out and non-completion are embedded features of the current higher education landscape.
Community colleges play a central role in shaping the SCNC population, as the majority of adults with some college but no credential last enrolled in public two-year institutions. This concentration indicates that completion gaps at the community college level have outsized implications for national attainment and workforce outcomes.
The widespread growth of the SCNC population across all states highlights that incomplete college pathways are a national issue, not a regionally isolated problem. While large states account for the highest absolute numbers, consistent increases in nearly every state point to the need for coordinated, state-level and federal policy responses.
Demographic patterns within the SCNC population have remained relatively stable over time, with near parity by gender and broad representation across racial and age groups. At the same time, faster growth among Hispanic adults and the large share of younger learners underscore both equity considerations and opportunities for targeted re-engagement strategies.
Despite the growing pool of adults with some college experience, re-enrollment and completion rates remain persistently low, signaling that existing pathways back to higher education are insufficient. Without scalable interventions focused on credit recovery, flexible credentials, and adult-learner support, the gap between college entry and degree attainment is likely to continue widening.
Sources
- Graduation Rate from First Institution Attended for First-Time, Full-Time Bachelor’s Degree-Seeking Students at 4-Year Postsecondary Institutions, by Race/Ethnicity, Time to Completion, Sex, Control of Institution, and Percentage of Applications Accepted: Selected Cohort Entry Years, 1996 through 2017. https://nces.ed.gov/programs/digest/d24/tables/dt24_326.10.asp. Accessed 29 December 2025.
- “Some College, No Credential.” National Student Clearinghouse Research Center Home, 4 June 2025, https://nscresearchcenter.org/some-college-no-credential/. Accessed 29 December 2025.