Key findings:
School lunch debt in the U.S. exceeds $1.3 billion.
About 30.4 million students cannot afford school meals, and over 13 million children live in food-insecure households.
The average school lunch costs $3.09 or about $556 per student per year, making daily meals a financial strain for many families.
Lunch prices range from $2.92 in the Southeast to $3.58 in the West, reflecting regional cost differences.
Schools where over 65% of students receive free or reduced meals report far less unpaid meal debt.
Nearly all schools face rising costs, with food, labor, and equipment expenses cited as top challenges.
Over 20 million students now eat free school lunches, showing the growing importance of meal assistance programs.
What is school lunch debt?
School meals are a daily necessity for millions of American students, yet for many families, even a few dollars per day can add up to a financial burden. As food prices continue to rise, questions about the true cost of school lunches and the growing issue of unpaid meal debt have become more urgent.
School lunch debt is the amount of money owed to schools when students receive meals, but their families cannot or do not pay for them.
In the U.S., public schools must still feed students even if they have insufficient funds in their meal accounts. When these unpaid meal balances accumulate, they become school lunch debt.
Across the United States, school lunch debt and meal affordability have become urgent issues affecting millions of students and families. The growing burden of school lunch debt reflects deeper inequalities in the American education system. As food prices and operational costs rise, schools struggle to provide affordable, nutritious meals while maintaining quality. Millions of students are unable to afford school lunches, and districts face increasing pressure to cover unpaid balances, revealing how something as simple as a school meal has become a complex social and economic problem.
Total national and state-level school meal debt
Rising school lunch debt
The chart below illustrates the trend in median unpaid school lunch debt reported by U.S. public schools from 2015 to 2024.
Over the past decade, the median amount of unpaid meal charges per district has increased significantly, reflecting both higher food costs and persistent gaps in meal affordability.
This growing school lunch debt problem underscores how many families struggle to cover the price of daily school meals despite federal support programs.
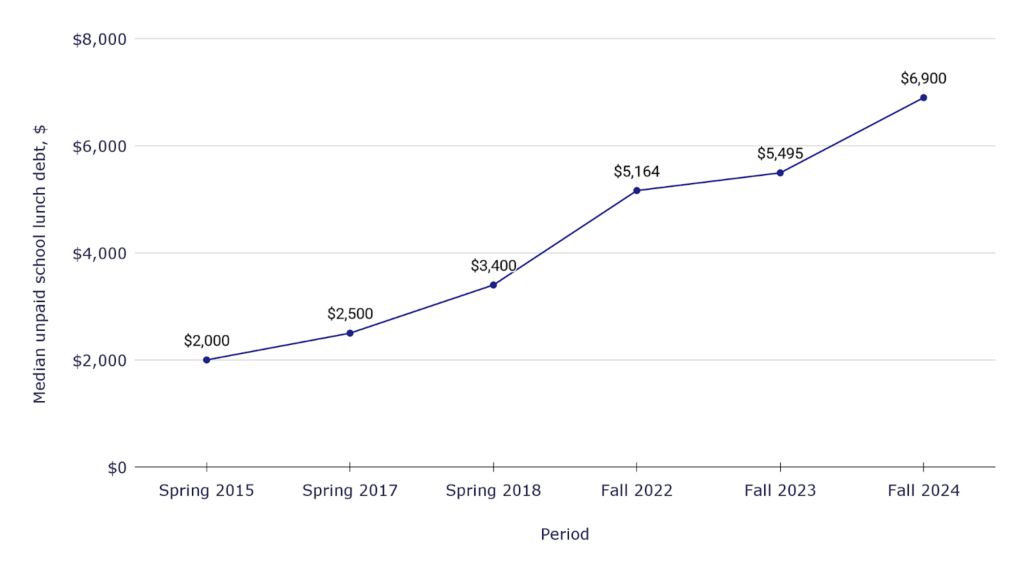
- The median unpaid school lunch debt rose from $2,000 in Spring 2015 to $6,900 in Fall 2024, marking a 245% increase in less than ten years.
- Between Fall 2022 and Fall 2024, the debt increased by 34%, showing that unpaid meal balances continue to accelerate post-pandemic.
School lunch debt statistics: tracking the growth of unpaid meal balances in U.S. public schools
The steady rise in school lunch debt reflects a growing disconnect between meal program funding and the real cost of providing food in schools.
Even as reimbursement rates have increased, many districts continue to accumulate unpaid balances, suggesting that thousands of students remain unable to afford regular school lunches.
Efforts to pay off school lunch debt, including community donations and school lunch debt charity programs, have provided temporary relief, but the data suggest a systemic challenge requiring sustainable policy solutions.
After looking at national trends in unpaid meal charges, it’s important to understand how school lunch debt varies across individual states and where the burden is most severe.
Total school lunch debt by state: where unpaid meal balances are the highest
The chart below shows the estimated school meal debt for each U.S. state.
The figures reflect the combined value of unpaid school lunches in public schools, highlighting the scale of lunch debt nationwide.
While every state reports some level of outstanding meal balances, the concentration of school lunch debt is significantly higher in large and high-cost states, pointing to both population size and local food pricing as key factors.
- Texas reports the highest school meal debt, reaching $166.3 million, followed by California with $141.9 million and Florida with $80.2 million.
- Smaller states such as Vermont ($1.6 million) and North Dakota ($2.4 million) show the lowest totals, illustrating the wide range in school lunch debt across the U.S.
- In total, all states account for more than $1.3 billion in unpaid meal charges, underlining the nationwide scope of school lunch debt statistics.
School lunch debt statistics by state
| State | School meal debt, $ |
| Alabama | $24,897,629 |
| Alaska | $3,083,141 |
| Arizona | $28,942,574 |
| Arkansas | $16,686,518 |
| California | $141,851,304 |
| Colorado | $17,143,574 |
| Connecticut | $12,187,498 |
| Delaware | $3,767,731 |
| District of Columbia | $1,845,115 |
| Florida | $80,170,603 |
| Georgia | $49,293,490 |
| Hawaii | $6,045,062 |
| Idaho | $7,515,590 |
| Illinois | $41,649,725 |
| Indiana | $29,084,659 |
| Iowa | $11,945,059 |
| Kansas | $12,545,194 |
| Kentucky | $21,246,149 |
| Louisiana | $24,703,877 |
| Maine | $5,028,610 |
| Maryland | $21,763,814 |
| Massachusetts | $17,590,694 |
| Michigan | $40,010,285 |
| Minnesota | $18,382,594 |
| Mississippi | $15,419,678 |
| Missouri | $24,702,883 |
| Montana | $3,984,336 |
| Nebraska | $9,134,165 |
| Nevada | $13,570,589 |
| New Hampshire | $3,592,858 |
| New Jersey | $26,991,144 |
| New Mexico | $10,372,190 |
| New York | $74,537,885 |
| North Carolina | $43,539,552 |
| North Dakota | $2,435,314 |
| Ohio | $51,413,832 |
| Oklahoma | $23,031,648 |
| Oregon | $14,413,162 |
| Pennsylvania | $47,218,853 |
| Rhode Island | $3,073,205 |
| South Carolina | $19,506,355 |
| South Dakota | $3,970,426 |
| Tennessee | $30,694,291 |
| Texas | $166,288,896 |
| Utah | $15,996,960 |
| Vermont | $1,585,786 |
| Virginia | $26,005,493 |
| Washington | $27,921,154 |
| West Virginia | $7,068,470 |
| Wisconsin | $20,130,336 |
| Wyoming | $2,705,573 |
What is student lunch debt in Arkansas?
- Student lunch debt in Arkansas is $16,686,518.
What is student lunch debt in California?
- Student lunch debt in California is $141,851,304.
What is student lunch debt in Delaware?
- Student lunch debt in Delaware is $3,767,731.
What is student lunch debt in Florida?
- Student lunch debt in Florida is $80,170,603.
What is student lunch debt in Georgia?
- Student lunch debt in Georgia is $49,293,490.
What is student lunch debt in Massachusetts?
- Student lunch debt in Massachusetts is $17,590,694.
What is student lunch debt in North Carolina?
- Student lunch debt in North Carolina is $43,539,552.
What is student lunch debt in Tennessee?
- Student lunch debt in Tennessee is $30,694,291.
What is student lunch debt in Texas?
- Student lunch debt in Texas is $166,288,896.
What is student lunch debt in Washington?
- Student lunch debt in Washington is $27,921,154.
The distribution of school lunch debt across states reveals how deeply financial hardship affects school meal programs at every level.
High-debt states often combine large student populations with higher food and labor costs, while smaller or less populated states still experience persistent lunch debt challenges on a per-student basis.
These school lunch statistics emphasize that unpaid meal balances are not isolated incidents but a systemic issue, one that many communities are now addressing through donation drives and school lunch debt charity initiatives aimed at paying off school lunch debt and ensuring every student has access to a meal.
After assessing the total dollar amount of unpaid meal balances, it’s equally important to examine how widespread school lunch debt is across different states and USDA regions.
Percentage of schools with unpaid meal debt by state
The chart below shows the percentage of schools reporting unpaid meal debt by state, grouped by USDA Food and Nutrition Service (FNS) regions.
This metric captures how common school lunch debt has become rather than how large the unpaid balances are.
It reveals that in most parts of the country, a majority of schools are struggling with at least some level of outstanding lunch debt, suggesting a broad, systemic challenge that goes beyond regional or economic differences.
- Mountain Plains states report the highest concentration of unpaid meal balances, with an average of 69.8% of schools carrying school lunch debt.
- Southwest and Midwest regions follow closely, where around 63-67% of schools report some level of lunch debt.
- The lowest share appears in the Western region, where roughly 36% of schools report unpaid meal charges, showing the most limited spread of school lunch debt among all USDA regions.
Share of schools reporting unpaid meal balances
| State | USDA FNS Region | Reported unpaid meal debt, % |
| Alabama | Southeast | 42.2% |
| Alaska | Western | 36.2% |
| Arizona | Southwest | 63.4% |
| Arkansas | Southwest | 63.4% |
| California | Western | 36.2% |
| Colorado | Mountain Plains | 69.8% |
| Connecticut | Northeast | 45.9% |
| Delaware | Mid-Atlantic | 60.7% |
| Florida | Southeast | 42.2% |
| Georgia | Southeast | 42.2% |
| Hawaii | Western | 36.2% |
| Idaho | Western | 36.2% |
| Illinois | Midwest | 66.8% |
| Indiana | Midwest | 66.8% |
| Iowa | Midwest | 66.8% |
| Kansas | Mountain Plains | 69.8% |
| Kentucky | Southeast | 42.2% |
| Louisiana | Southwest | 63.4% |
| Maine | Northeast | 45.9% |
| Maryland | Mid-Atlantic | 60.7% |
| Massachusetts | Northeast | 45.9% |
| Michigan | Midwest | 66.8% |
| Minnesota | Midwest | 66.8% |
| Mississippi | Southeast | 42.2% |
| Missouri | Mountain Plains | 69.8% |
| Montana | Mountain Plains | 69.8% |
| Nebraska | Mountain Plains | 69.8% |
| Nevada | Western | 36.2% |
| New Hampshire | Northeast | 45.9% |
| New Jersey | Mid-Atlantic | 60.7% |
| New Mexico | Southwest | 63.4% |
| New York | Northeast | 45.9% |
| North Carolina | Southeast | 42.2% |
| North Dakota | Mountain Plains | 69.8% |
| Ohio | Midwest | 66.8% |
| Oklahoma | Southwest | 63.4% |
| Oregon | Western | 36.2% |
| Pennsylvania | Mid-Atlantic | 60.7% |
| Rhode Island | Northeast | 45.9% |
| South Carolina | Southeast | 42.2% |
| South Dakota | Mountain Plains | 69.8% |
| Tennessee | Southeast | 42.2% |
| Texas | Southwest | 63.4% |
| Utah | Mountain Plains | 69.8% |
| Vermont | Northeast | 45.9% |
| Virginia | Mid-Atlantic | 60.7% |
| Washington | Western | 36.2% |
| West Virginia | Mid-Atlantic | 60.7% |
| Wisconsin | Midwest | 66.8% |
| Wyoming | Mountain Plains | 69.8% |
- 55% of schools face unpaid student meal debt.
- The average meal debt per child is $180.6, yearly.
The data show that school lunch debt is a nationwide issue, affecting nearly every region of the United States.
Even in states with lower reported percentages, tens of thousands of students still face difficulties accessing or affording school meals.
The high proportion of affected schools in the Midwest, Southwest, and Mountain Plains regions underscores how economic pressures, local meal costs, and limited funding continue to drive the growth of school lunch debt statistics.
While local school lunch debt charity programs help pay off school lunch debt, the persistence of unpaid balances across so many schools suggests the need for more comprehensive policy solutions.
After reviewing how unpaid meal debt spreads across states, the next step is to understand how many students are unable to afford school meals in the first place, and where food insecurity is most concentrated.
Food-insecure children
How many students are unable to afford school meals in America?
The chart below presents the estimated number of food-insecure children in each U.S. state for 2023, based on data from Feeding America’s Map the Meal Gap. These figures represent children who live in households lacking consistent access to adequate food, many of whom struggle to afford daily school lunches. Understanding how many students are unable to afford meals in America helps explain why unpaid lunch balances continue to grow despite federal nutrition assistance programs.
- In Texas, nearly 1.67 million children are food insecure, the highest number of any state, followed by California with 1.43 million and Florida with 806,870.
- The states with the fewest food-insecure children are Vermont (15,960) and North Dakota (25,510), showing smaller populations but persistent need.
- Nationwide, more than 13 million children lived in food-insecure households in 2023, illustrating how a significant percentage of students can’t afford school lunch regularly.
How many students are unable to afford meals in America?
- 30.4 million students can’t afford their school meals as of 2024.
Food-insecure children: the hidden crisis behind school lunch access
| State | Number of food-insecure children in 2023 |
| Alabama | 250,580 |
| Alaska | 31,030 |
| Arizona | 291,290 |
| Arkansas | 167,940 |
| California | 1,427,650 |
| Colorado | 172,540 |
| Connecticut | 122,660 |
| Delaware | 37,920 |
| District of Columbia | 18,570 |
| Florida | 806,870 |
| Georgia | 496,110 |
| Hawaii | 60,840 |
| Idaho | 75,640 |
| Illinois | 419,180 |
| Indiana | 292,720 |
| Iowa | 120,220 |
| Kansas | 126,260 |
| Kentucky | 213,830 |
| Louisiana | 248,630 |
| Maine | 50,610 |
| Maryland | 219,040 |
| Massachusetts | 177,040 |
| Michigan | 402,680 |
| Minnesota | 185,010 |
| Mississippi | 155,190 |
| Missouri | 248,620 |
| Montana | 40,100 |
| Nebraska | 91,930 |
| Nevada | 136,580 |
| New Hampshire | 36,160 |
| New Jersey | 271,650 |
| New Mexico | 104,390 |
| New York | 750,180 |
| North Carolina | 438,200 |
| North Dakota | 24,510 |
| Ohio | 517,450 |
| Oklahoma | 231,800 |
| Oregon | 145,060 |
| Pennsylvania | 475,230 |
| Rhode Island | 30,930 |
| South Carolina | 196,320 |
| South Dakota | 39,960 |
| Tennessee | 308,920 |
| Texas | 1,673,600 |
| Utah | 161,000 |
| Vermont | 15,960 |
| Virginia | 261,730 |
| Washington | 281,010 |
| West Virginia | 71,140 |
| Wisconsin | 202,600 |
| Wyoming | 27,230 |
The data reveal that millions of students who are unable to afford school meals depend on school nutrition programs as their most reliable source of daily food. While states like Texas, California, and Florida face the highest absolute numbers, nearly every state reports thousands of children at risk of hunger. These school lunch statistics highlight the close connection between food insecurity and school lunch debt, suggesting that solving one issue requires addressing the other.
Without sustained funding and broader eligibility for free school meals, the number of students unable to afford school meals is likely to remain alarmingly high.
After exploring how many students struggle to afford school meals, it’s important to understand how much those meals actually cost and how pricing varies across grade levels.
School lunch costs and pricing
Average school lunch cost and pricing trends across U.S. schools
The chart below illustrates the average school lunch cost and breakfast price in U.S. public schools by grade level. While breakfast remains relatively affordable, lunch prices show a noticeable increase as students progress from elementary to high school. Understanding the average cost of lunch in the USA helps reveal the financial burden that both schools and families face each year.

- The average lunch cost rises from $2.93 in elementary schools to $3.21 in high schools, marking a 10% increase.
- Breakfast prices range from $1.84 to $1.97, remaining nearly 35% lower than lunch prices across all grade levels.
How much do school lunches cost in the U.S.?
- The average cost of a school lunch in the U.S. is $3.09.
- The average cost of a school breakfast in the U.S. is $1.91.
How much do school lunches cost per year?
- School lunches cost about $556 per student per year.
Overall, school lunch prices show a gradual upward trend as grade level increases, reflecting higher portion sizes and food costs for older students. While breakfast remains a more affordable option, the cumulative yearly expense of school lunches represents a significant cost for families, especially those without free or reduced-price meal eligibility. These pricing patterns highlight the ongoing challenge of balancing nutritional standards, affordability, and funding adequacy in the U.S. school meal system.
Having explored national school lunch costs, it’s important to examine how school lunch pricing varies regionally and across individual states.
Regional variations in school lunch prices across the U.S.
The chart below illustrates the average school lunch price by state and USDA FNS region. Prices for school lunch in Texas, Florida, California, and other states demonstrate significant regional variation, reflecting differences in local food costs, labor, and school funding. These statistics about school lunches help contextualize why some regions face higher meal expenses than others and the financial implications for families and schools alike.
- Western states, including California, Alaska, and Hawaii, have the highest average school lunch price at $3.58 per meal.
- Most Southeast states, such as Alabama, Florida, Georgia, and North Carolina, maintain lower lunch prices at $2.92 per meal.
- The Mid-Atlantic and Mountain Plains regions report intermediate prices, with average lunch prices ranging from $3.02 to $3.10.
How much is school lunch in different states?
| State | USDA FNS Region | Average school lunch price, $ |
| Alabama | Southeast | $2.92 |
| Alaska | Western | $3.58 |
| Arizona | Southwest | $2.93 |
| Arkansas | Southwest | $2.93 |
| California | Western | $3.58 |
| Colorado | Mountain Plains | $3.10 |
| Connecticut | Northeast | $3.42 |
| Delaware | Mid-Atlantic | $3.02 |
| Florida | Southeast | $2.92 |
| Georgia | Southeast | $2.92 |
| Hawaii | Western | $3.58 |
| Idaho | Western | $3.58 |
| Illinois | Midwest | $3.05 |
| Indiana | Midwest | $3.05 |
| Iowa | Midwest | $3.05 |
| Kansas | Mountain Plains | $3.10 |
| Kentucky | Southeast | $2.92 |
| Louisiana | Southwest | $2.93 |
| Maine | Northeast | $3.42 |
| Maryland | Mid-Atlantic | $3.02 |
| Massachusetts | Northeast | $3.42 |
| Michigan | Midwest | $3.05 |
| Minnesota | Midwest | $3.05 |
| Mississippi | Southeast | $2.92 |
| Missouri | Mountain Plains | $3.10 |
| Montana | Mountain Plains | $3.10 |
| Nebraska | Mountain Plains | $3.10 |
| Nevada | Western | $3.58 |
| New Hampshire | Northeast | $3.42 |
| New Jersey | Mid-Atlantic | $3.02 |
| New Mexico | Southwest | $2.93 |
| New York | Northeast | $3.42 |
| North Carolina | Southeast | $2.92 |
| North Dakota | Mountain Plains | $3.10 |
| Ohio | Midwest | $3.05 |
| Oklahoma | Southwest | $2.93 |
| Oregon | Western | $3.58 |
| Pennsylvania | Mid-Atlantic | $3.02 |
| Rhode Island | Northeast | $3.42 |
| South Carolina | Southeast | $2.92 |
| South Dakota | Mountain Plains | $3.10 |
| Tennessee | Southeast | $2.92 |
| Texas | Southwest | $2.93 |
| Utah | Mountain Plains | $3.10 |
| Vermont | Northeast | $3.42 |
| Virginia | Mid-Atlantic | $3.02 |
| Washington | Western | $3.58 |
| West Virginia | Mid-Atlantic | $3.02 |
| Wisconsin | Midwest | $3.05 |
| Wyoming | Mountain Plains | $3.10 |
How much is school lunch in Alabama?
- School lunch in Alabama costs $2.92.
How much is school lunch in Alaska?
- School lunch in Alaska costs $3.58.
How much is school lunch in Arizona?
- School lunch in Arizona costs $2.93.
How much is school lunch in Arkansas?
- School lunch in Arkansas costs $2.93.
How much is school lunch in California?
- School lunch in California costs $3.58.
How much is school lunch in Colorado?
- School lunch in Colorado costs $3.10.
How much is school lunch in Connecticut?
- School lunch in Connecticut costs $3.42.
How much is school lunch in Delaware?
- School lunch in Delaware costs $3.02.
How much is school lunch in Florida?
- School lunch in Florida costs $2.92.
How much is school lunch in Georgia?
- School lunch in Georgia costs $2.92.
How much is school lunch in Hawaii?
- School lunch in Hawaii costs $3.58.
How much is school lunch in Idaho?
- School lunch in Idaho costs $3.58.
How much is school lunch in Illinois?
- School lunch in Illinois costs $3.05.
How much is school lunch in Indiana?
- School lunch in Indiana costs $3.05.
How much is school lunch in Iowa?
- School lunch in Iowa costs $3.05.
How much is school lunch in Kansas?
- School lunch in Kansas costs $3.10.
How much is school lunch in Kentucky?
- School lunch in Kentucky costs $2.92.
How much is school lunch in Louisiana?
- School lunch in Louisiana costs $2.93.
How much is school lunch in Maine?
- School lunch in Maine costs $3.42.
How much is school lunch in Maryland?
- School lunch in Maryland costs $3.02.
How much is school lunch in Massachusetts?
- School lunch in Massachusetts costs $3.42.
How much is school lunch in Michigan?
- School lunch in Michigan costs $3.05.
How much is school lunch in Minnesota?
- School lunch in Minnesota costs $3.05.
How much is school lunch in Mississippi?
- School lunch in Mississippi costs $2.92.
How much is school lunch in Missouri?
- School lunch in Missouri costs $3.10.
How much is school lunch in Montana?
- School lunch in Montana costs $3.10.
How much is school lunch in Nebraska?
- School lunch in Nebraska costs $3.10.
How much is school lunch in Nevada?
- School lunch in Nevada costs $3.58.
How much is school lunch in New Hampshire?
- School lunch in New Hampshire costs $3.42.
How much is school lunch in New Jersey?
- School lunch in New Jersey costs $3.02.
How much is school lunch in New Mexico?
- School lunch in New Mexico costs $2.93.
How much is school lunch in New York?
- School lunch in New York costs $3.42.
How much is school lunch in North Carolina?
- School lunch in North Carolina costs $2.92.
How much is school lunch in North Dakota?
- School lunch in North Dakota costs $3.10.
How much is school lunch in Ohio?
- School lunch in Ohio costs $3.05.
How much is school lunch in Oklahoma?
- School lunch in Oklahoma costs $2.93.
How much is school lunch in Oregon?
- School lunch in Oregon costs $3.58.
How much is school lunch in Pennsylvania?
- School lunch in Pennsylvania costs $3.02.
How much is school lunch in Rhode Island?
- School lunch in Rhode Island costs $3.42.
How much is school lunch in South Carolina?
- School lunch in South Carolina costs $2.92.
How much is school lunch in South Dakota?
- School lunch in South Dakota costs $3.10.
How much is school lunch in Tennessee?
- School lunch in Tennessee costs $2.92.
How much is school lunch in Texas?
- School lunch in Texas costs $2.93.
How much is school lunch in Utah?
- School lunch in Utah costs $3.10.
How much is school lunch in Vermont?
- School lunch in Vermont costs $3.42.
How much is school lunch in Virginia?
- School lunch in Virginia costs $3.02.
How much is school lunch in Washington?
- School lunch in Washington costs $3.58.
How much is school lunch in West Virginia?
- School lunch in West Virginia costs $3.02.
How much is school lunch in Wisconsin?
- School lunch in Wisconsin costs $3.05.
How much is school lunch in Wyoming?
- School lunch in Wyoming costs $3.10.
Regional differences in school lunch pricing are substantial, with Western states consistently charging more than Southeast and Midwest states. Local cost-of-living, food supply expenses, and school funding mechanisms influence these variations. Families in higher-cost regions may face greater financial pressure, while schools in lower-cost areas may struggle to maintain meal quality under limited budgets.
After examining regional school lunch prices, it is important to understand how the free lunch program and the share of free-and-reduced meals relate to unpaid meal charges in schools.
Free or reduced school lunch programs
How free and reduced meals affect school lunch debt across programs
The chart below shows the percentage of programs reporting any unpaid meal charges based on the proportion of students eligible for free or reduced-price meals.
Programs with fewer students qualifying for free meals tend to report higher unpaid balances, highlighting the relationship between school lunch funding, meal affordability, and program participation.
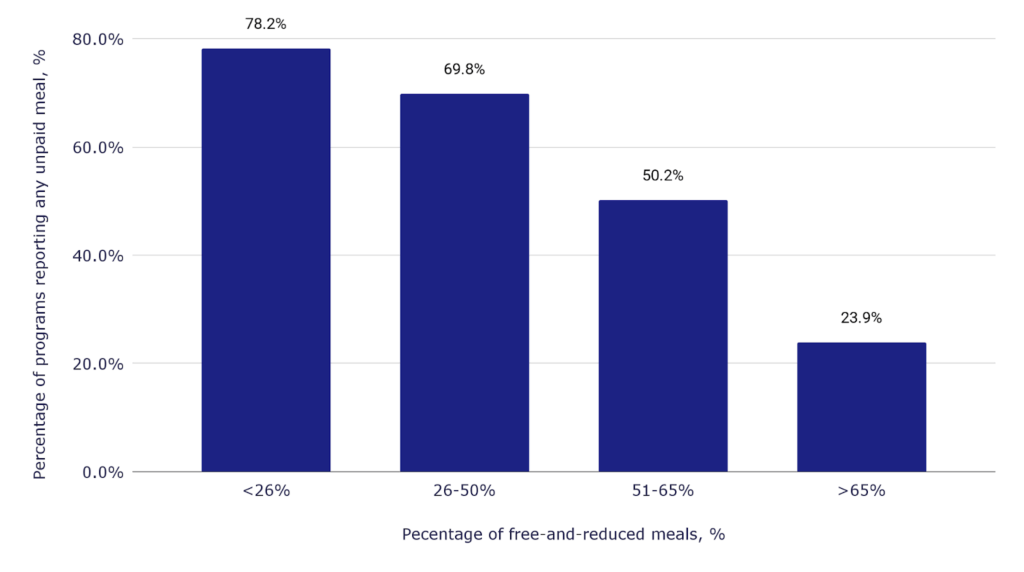
- Programs with less than 26% of students receiving free or reduced meals report the highest unpaid meal charges, with 78.2% of programs affected.
- Programs with 26-50% of students eligible have a lower share of unpaid balances at 69.8%, showing a decline as more students receive subsidized meals.
- Programs where over 65% of students qualify for free/reduced meals report the lowest rate of unpaid charges, only 23.9%, indicating near-universal coverage reduces debt.
Percentage of schools reporting unpaid meal charges by free meal eligibility
| Pecentage of free-and-reduced meals, % | Percentage of programs reporting any unpaid meal |
| <26% | 78.2% |
| 26-50% | 69.8% |
| 51-65% | 50.2% |
| >65% | 23.9% |
The data demonstrate a clear correlation between the proportion of students receiving free and reduced-price meals and the prevalence of unpaid meal charges. Programs with high participation in free lunch for all students tend to experience far less debt, underscoring the benefits of comprehensive meal coverage. Even in states where school lunch funding is supplemented through federal programs, partial eligibility can leave significant gaps, highlighting the importance of expanding access and ensuring sustainable funding for school meal programs.
After analyzing unpaid meal charges and regional lunch pricing, it’s critical to examine whether school lunch funding and federal reimbursements are sufficient to cover the actual cost of providing meals.
Are school meal reimbursements sufficient to cover costs?
The chart below shows the percentage of programs reporting that reimbursements fully cover breakfast and lunch costs over three school years. Despite federal support through programs like the National School Lunch Program, many schools still struggle to match reimbursement rates with the real cost of producing meals.

- In 2022-23, 27.2% of programs reported that reimbursements covered breakfast costs, while only 24.9% covered lunch costs.
- By 2023-24, these percentages dropped to 20.7% for breakfast and 17.0% for lunch, showing a decline in coverage.
- In 2024-25, coverage slightly increased to 24.8% for breakfast and 20.5% for lunch, indicating that even with modest improvements, the majority of programs still do not fully cover meal costs.
How much do schools get paid per student, and does it cover meal expenses?
The data highlight a persistent gap between federal reimbursements and actual meal costs, emphasizing that many schools rely on additional funding or local resources to maintain their nutrition programs. Even with rising participation in free school lunch programs, the majority of schools report that reimbursements do not fully cover expenses, particularly for lunch.
These findings underscore the ongoing challenges in school lunch funding, illustrating the financial pressures schools face while striving to provide nutritious meals for all students.
After examining meal costs and reimbursement coverage, it is important to address school lunch quality and the challenges that affect program delivery nationwide.
School lunch program problems
School lunch: common challenges in U.S. meal programs
The chart below illustrates the most significant challenges reported by school meal programs.
From rising food and labor costs to difficulties meeting nutrition standards, these factors contribute to school lunch issues and affect both program efficiency and student nutrition.
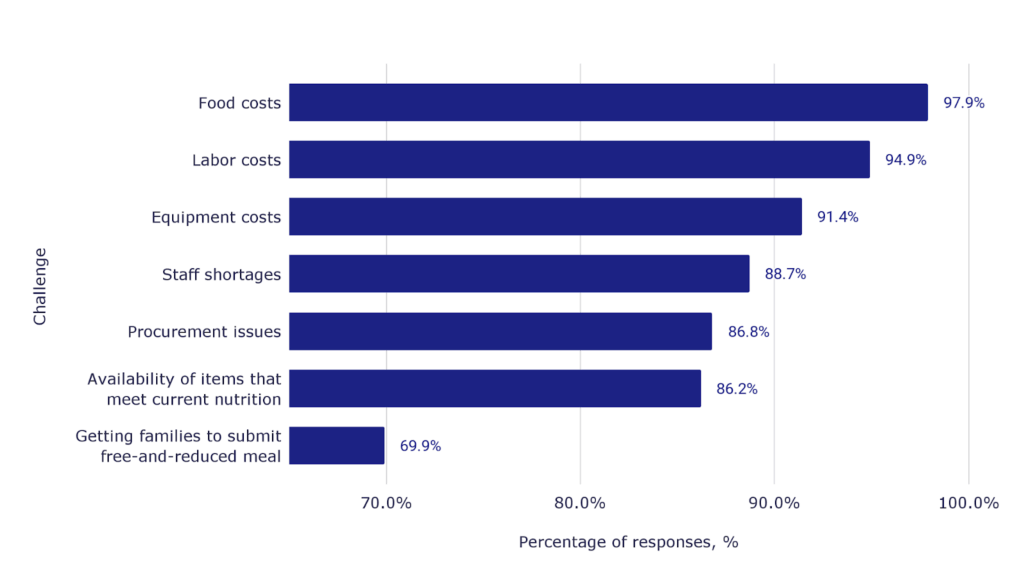
- Food costs are the most reported challenge, affecting 97.9% of programs, highlighting the financial pressure on schools.
- Labor and equipment costs remain significant, with 94.9% and 91.4% of programs impacted, respectively, reflecting operational strains.
- Issues such as procurement challenges and meeting current nutrition standards affect over 86% of programs, while getting families to submit free-and-reduced meal applications is a challenge for 69.9% of schools.
Problems with school lunches: costs, staffing, and nutrition
The data reveal that problems with the national school lunch program are multifaceted, combining cost, staffing, and logistical issues. High operational expenses, staff shortages, and procurement difficulties make it challenging for schools to consistently provide nutritious meals.
Addressing these school lunch problems requires policy support, better funding, and streamlined processes to ensure that programs meet both nutrition standards and the needs of students.
Following the analysis of school lunch quality and operational challenges, it’s important to examine how many students actually receive free school lunch across the country.
Student participation in free school lunch programs
Student participation in free school lunch programs by state
The chart below shows the number and share of students participating in free school lunch programs for the 2022-23 and 2023-24 school years.
These figures highlight trends in program participation and indicate which states rely most heavily on free lunch for all students to ensure daily nutrition.
Understanding how many students eat school lunch is critical for assessing both student access to meals and the overall effectiveness of federal and state nutrition programs.
- In Texas, over 2.62 million students (77.4%) received free school lunch in 2023-24, showing a slight increase from 2.53 million (75.8%) in 2022-23.
- South Carolina experienced a major increase, with 85.6% of students participating in free lunch programs in 2023-24, up from 71.2% the previous year.
- Some states, such as New Hampshire and North Dakota, maintain lower participation rates at 28.6% and 27.9% respectively, highlighting regional differences in program reach.
How many students receive free school lunch in the U.S.?
| State | 2022-23 | 2023-24 | ||
| Number of students | % of Total | Number of students | % of Total | |
| Alabama | 356,588 | 74.00% | 424,599 | 83.50% |
| Alaska | 29,300 | 68.80% | 28,290 | 68.00% |
| Arizona | 334,472 | 61.30% | 400,472 | 69.70% |
| Arkansas | 184,808 | 60.50% | 187,184 | 60.20% |
| California | 2,134,682 | 66.60% | 2,207,137 | 67.00% |
| Colorado | 156,973 | 45.90% | 204,238 | 46.30% |
| Connecticut | 185,495 | 58.80% | 190,473 | 64.30% |
| Delaware | 51,527 | 56.40% | 53,508 | 56.50% |
| District of Columbia | 40,077 | 82.90% | 38,339 | 75.60% |
| Florida | 1,390,519 | 82.30% | 1,491,547 | 83.60% |
| Georgia | 720,593 | 66.50% | 798,145 | 70.80% |
| Hawaii | 49,706 | 55.30% | 52,011 | 56.50% |
| Idaho | 56,309 | 42.20% | 57,199 | 43.70% |
| Illinois | 682,101 | 75.00% | 720,546 | 76.80% |
| Indiana | 412,919 | 58.40% | 449,077 | 62.40% |
| Iowa | 171,837 | 47.60% | 177,155 | 48.90% |
| Kansas | 153,103 | 48.80% | 165,833 | 52.40% |
| Kentucky | 415,286 | 85.50% | 426,848 | 86.20% |
| Louisiana | 407,334 | 82.50% | 431,999 | 85.10% |
| Maine | 38,612 | 34.30% | 39,566 | 34.10% |
| Maryland | 261,522 | 63.40% | 304,058 | 67.50% |
| Massachusetts | 335,798 | 56.60% | 365,572 | 59.00% |
| Michigan | 543,916 | 70.30% | 589,616 | 67.40% |
| Minnesota | 226,629 | 39.40% | 258,012 | 39.80% |
| Mississippi | 234,899 | 75.30% | 234,991 | 75.20% |
| Missouri | 261,136 | 49.70% | 263,743 | 50.40% |
| Montana | 35,968 | 48.20% | 41,865 | 55.70% |
| Nebraska | 114,596 | 47.70% | 120,004 | 50.00% |
| Nevada | 171,397 | 72.80% | 172,533 | 73.80% |
| New Hampshire | 20,664 | 27.70% | 21,571 | 28.60% |
| New Jersey | 330,258 | 52.60% | 382,491 | 54.00% |
| New Mexico | 144,875 | 78.60% | 148,416 | 73.70% |
| New York | 1,267,716 | 80.30% | 1,389,307 | 81.70% |
| North Carolina | 561,566 | 74.50% | 663,227 | 81.30% |
| North Dakota | 25,871 | 27.80% | 26,003 | 27.90% |
| Ohio | 504,364 | 54.40% | 555,292 | 58.60% |
| Oklahoma | 237,626 | 60.90% | 263,692 | 66.40% |
| Oregon | 155,054 | 58.50% | 176,366 | 63.70% |
| Pennsylvania | 645,358 | 67.80% | 693,929 | 70.80% |
| Rhode Island | 38,649 | 55.10% | 37,487 | 52.30% |
| South Carolina | 321,133 | 71.20% | 419,171 | 85.60% |
| South Dakota | 33,818 | 33.70% | 34,615 | 34.70% |
| Tennessee | 385,104 | 62.90% | 432,260 | 68.10% |
| Texas | 2,528,786 | 75.80% | 2,625,641 | 77.40% |
| Utah | 104,856 | 34.00% | 114,186 | 35.70% |
| Vermont | 18,484 | 33.80% | 26,922 | 49.20% |
| Virginia | 452,287 | 64.80% | 496,973 | 68.10% |
| Washington | 290,194 | 62.40% | 302,544 | 62.00% |
| West Virginia | 133,898 | 80.40% | 139,646 | 83.60% |
| Wisconsin | 244,329 | 51.80% | 258,104 | 53.80% |
| Wyoming | 15,087 | 34.30% | 18,284 | 42.60% |
How many students eat free lunch?
- 20 million students eat free lunch in 2024.
What percent of students eat free lunch?
- 62% students eat free lunch in 2024.
Overall, the data demonstrate that a majority of students in many states rely on free school lunch for daily nutrition, with particularly high participation in Southern and Western states. States with the largest student populations, like California and Texas, show consistent increases in program participation, reflecting ongoing need and program expansion. Conversely, smaller states or those with lower poverty rates, such as New Hampshire and North Dakota, maintain relatively low participation. These trends underscore the importance of federal and state support in providing meals to students who might otherwise go hungry, illustrating how school lunch programs play a vital role in student health and access to nutrition nationwide.
Conclusions
- School lunch debt has become a nationwide crisis, surpassing $1.3 billion and rising sharply since 2015. Despite federal assistance, unpaid meal balances continue to grow, revealing how millions of families still struggle to cover the cost of daily school meals. The steady increase in debt highlights broader issues of affordability and unequal access to food across U.S. school districts.
- Food insecurity remains a defining factor in student well-being. With 30.4 million students unable to afford school meals and over 13 million children living in food-insecure households, school nutrition programs serve as a critical safety net. The data show that hunger is not limited to low-income regions; it affects students nationwide, from large states like Texas and California to smaller, rural communities.
- The cost of school meals continues to rise, straining both families and schools. An average lunch now costs $3.09 or about $556 per year, and prices are notably higher in Western states. This regional gap reflects deeper economic differences, where local food and labor costs make providing affordable, nutritious meals even more difficult.
- Expanding free and reduced meal programs has proven effective in reducing unpaid balances. Schools where most students qualify for free meals report significantly less debt, underscoring how universal meal coverage can ease financial pressure and promote equal access to nutrition for all students.
- Yet the system faces mounting financial and operational challenges. Nearly all meal programs report rising food, labor, and equipment costs, threatening their sustainability. Without stronger funding and policy support, schools will continue struggling to balance budgets while ensuring students don’t go hungry.
- Despite these challenges, participation in free lunch programs is growing, with over 20 million students now receiving free meals. This expansion demonstrates how essential these programs have become in fighting childhood hunger, and why sustained investment is crucial to secure every child’s right to a daily, nutritious meal.
Methodology
1. To estimate the average cost of a school lunch in each U.S. state, we grouped states according to the USDA Food and Nutrition Service (FNS) regional classification. Within each region, publicly available data from school district websites, state education departments, and the School Nutrition Association reports were collected.
For each state, lunch prices reported by multiple school districts were averaged to obtain a representative statewide estimate. When district-level data were unavailable, regional or national averages were used to fill data gaps, adjusted based on cost-of-living differences and USDA reimbursement rates.
This approach ensures comparability across states while reflecting local variations in school meal pricing policies.
2. Estimating State-Level School Meal Debt
Estimated School Meal Debt = (Average Annual Cost of School Meals per Child) × (Number of Food-Insecure Children) × C
This formula approximates the potential unpaid meal debt accumulated in U.S. schools by combining cost, need, and attendance factors.
Average Annual Cost of School Meals per Child
Based on School Nutrition Association data, the reimbursement rate for a free school lunch in 2025 is $4.60 per meal.
Assuming a standard 180-day school year, the annual cost per student is:
$4.60 × 180 = $828 per child per year.
Number of Food-Insecure Children
State-level figures for food-insecure children are taken from the Feeding America Map the Meal Gap dataset.
Coefficient (C)
The coefficient C adjusts for the share of food-insecure children who are enrolled in school. It is derived from national demographic and enrollment data:
- The child food insecurity rate was 20% in 2023.
- Share of under-18 population who are school-age (5-17): 0.72.
- School enrollment rate (ages 5-17): 0.98.
- Public school attendance share: 0.91.
- Homeschool share: 3.4%.
Combining these factors gives an approximate adjustment:
0.20 × 0.72 × 0.98 × 0.91 × (1 − 0.034) ≈ 0.12
Thus, C = 0.12, representing the estimated proportion of all food-insecure children who attend public schools and are potentially affected by meal debt.
Sources
- “Hunger & Poverty in the United States | Map the Meal Gap.” Map the Meal GapVisit Our Facebook PageVisit Our InstagramVisit Our LinkedIn PageVisit Our X.Com Feed, https://map.feedingamerica.org. Accessed 09 October 2025.
- Map the Meal Gap, https://map.feedingamerica.org. Accessed 09 October 2025.
- Institute, Indiana. “School Lunch Debt Statistics – Indiana Youth Institute.” Indiana Youth Institute, 3 Nov. 2003, https://iyi.org/resources/school-lunch-debt-statistics/. Accessed 09 October 2025.
- “School Meal Statistics – School Nutrition Association.” School Nutrition Association, 6 Oct. 2025, https://schoolnutrition.org/about-school-meals/school-meal-statistics/. Accessed 09 October 2025.
- https://frac.org/wp-content/uploads/Reach-Report-2025.pdf. Accessed 09 October 2025.
- https://schoolnutrition.org/wp-content/uploads/2025/01/2024-25-School-Nutrition-Trends-Report.pdf. Accessed 09 October 2025.