Key findings:
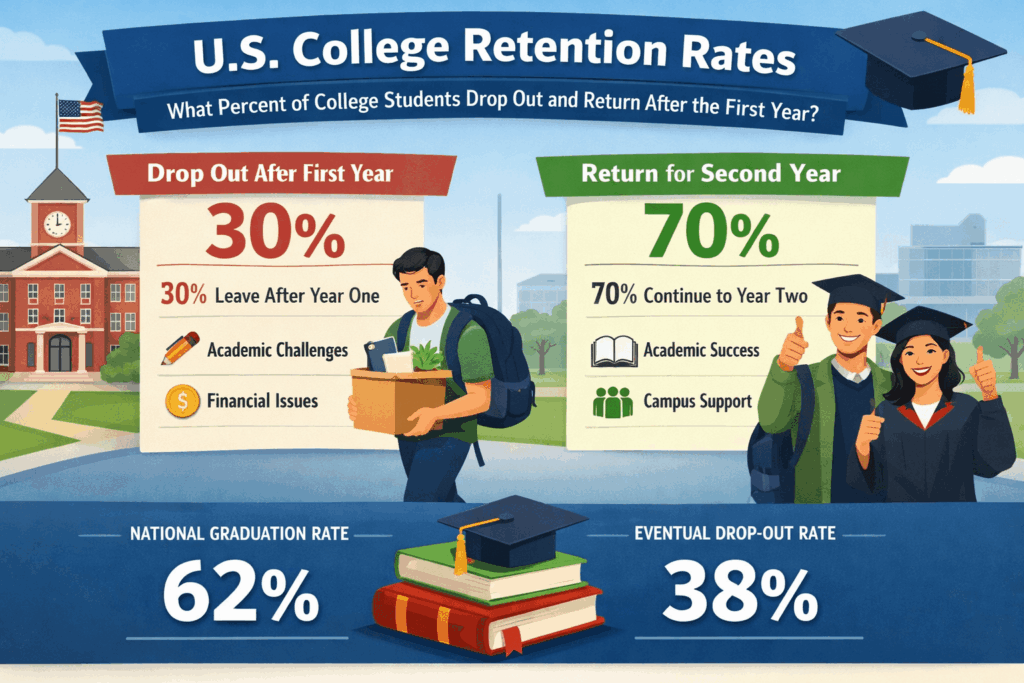
The U.S. overall student persistence rate increased from 72.9% in 2012-2013 to 77.7% in 2022-2023, reflecting a 4.8 percentage point gain in the share of students who continued their studies beyond the first year.
The U.S. overall college retention rate reached 77.7% in 2022-2023, up from 74.1% in 2016-2017, indicating a 3.6 percentage point increase over six years and a steady post-pandemic recovery trend.
Private nonprofit institutions posted the strongest retention outcomes, reaching 81.7% in 2022-2023, compared with 76.9% at public institutions and 66.1% at private for-profit institutions.
Public institutions improved first-year retention from 71.4% in 2012-2013 to 76.9% in 2022-2023, narrowing the gap with private nonprofit colleges by 5.5 percentage points.
Four-year institutions consistently outperformed two-year colleges, with public 4-year retention at 82.1% in 2022-2023 versus 64.5% at public 2-year institutions, a gap of 17.6 percentage points.
Racial disparities remain pronounced in 4-year institutions: Asian students reached 87.33% retention in 2023, while Black students recorded 67.68%, a difference of nearly 20 percentage points.
Age strongly predicts persistence, as students aged 20 or younger posted a 74.47% retention rate in 2023, compared with 48.31% for ages 21-24 and 46.16% for students 25 or older.
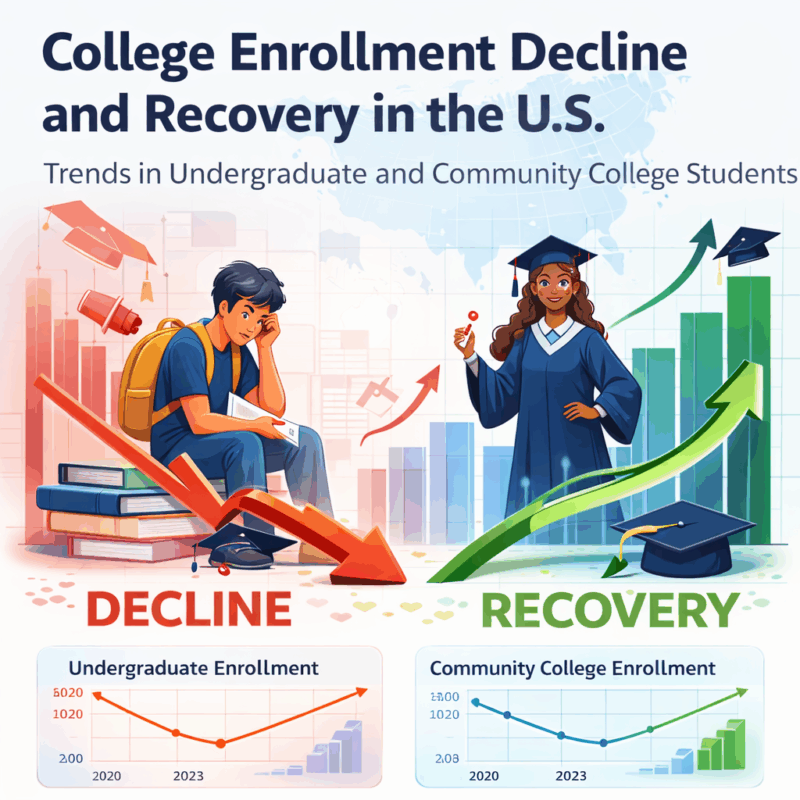
Community college first-year persistence increased from 59.3% in 2012-2013 to 64.5% in 2022-2023, yet 35.5% of students still did not return for a second year.
These retention gains occurred alongside long-term enrollment decline, with total U.S. college enrollment falling from 18.08 million in 2010 to 15.40 million in 2022, indicating ongoing structural constraints within the higher education system.
Student retention has become one of the most closely watched indicators of stability and performance in U.S. higher education. As enrollment patterns shift and demographic pressures intensify, understanding student retention rates, college retention rates, and long-term student persistence is essential for institutions, policymakers, and education analysts alike.
This article examines the rates of student return after their first year, the differences in retention by institution type, race, age, and gender, and the comparison between community colleges and four-year institutions. Using longitudinal national data, we break down first-year retention rate trends, percent of students returning for sophomore year, and the percentage of community college students who drop out, placing these metrics within the broader context of U.S. enrollment decline and recovery.
By connecting retention outcomes with enrollment trends over time, this analysis provides a clear, evidence-based view of where higher education is retaining students, and where attrition remains most severe. Whether you are researching student retention rates in higher education, evaluating institutional performance, or tracking national education trends, the data below offers a comprehensive foundation for understanding how persistence in U.S. colleges has evolved over the past decade.
U.S. first-year college retention rate trends
U.S. first-year college student retention rate trends (2012-2023)
The chart below shows the student retention rate for first-time undergraduates in the United States, tracking the first-year retention rate across selected academic years from 2012-2013 through 2022-2023. This metric reflects the percentage of students returning for their sophomore year, a core indicator used to assess college retention rates and overall student continuity in higher education.

- The first-year retention rate increased from 72.9% in 2012-2013 to 77.7% in 2022-2023, marking a gain of 4.8 percentage points over the period.
- During the pandemic period, the student retention rate dipped slightly from 76.2% in 2018-2019 to 75.7% in 2020-2021, before rebounding in subsequent years.
- By 2022-2023, the average college retention rate reached its highest observed level in the series at 77.7%, meaning roughly three out of four students returned for their second year.
How the U.S. first-year retention rate has changed since 2012
Overall, student retention rates in higher education have shown a gradual upward trend over the past decade, despite short-term disruptions around 2020. The steady recovery after the pandemic suggests that institutions were largely able to stabilize first-year outcomes, even as broader system pressures persisted. While these figures indicate improvement in college retention rates, they also imply that more than one in five students still do not return for their sophomore year.
After reviewing national first-year trends, it is important to examine how higher education retention differs across institution types within the U.S. higher education system.
College retention rates by institution type in the U.S.
Retention rates in higher education by institution type (2012-2023)
The chart compares retention rates in higher education by institution control, showing university retention rates for public, private nonprofit, and private for-profit institutions from 2012-2013 through 2022-2023. This breakdown highlights differences in academic retention and provides context for evaluating the retention rate for colleges across major sectors.

- Public institutions increased their higher education student retention from 71.4% in 2012-2013 to 76.9% in 2022-2023, a rise of 5.5 percentage points.
- Private nonprofit institutions consistently posted the highest university retention rates, reaching 81.7% in 2022-2023, compared with 76.9% at public institutions and 66.1% at private for-profit institutions.
- Private for-profit institutions showed the lowest retention rates in higher education across all years, fluctuating between 61.4% and 66.5% during the period.
College retention rates across public and private institutions
| Year | Public institutions, % | Private nonprofit institutions, % | Private for-profit institutions, % |
| 2012-2013 | 71.4% | 80.3% | 62.9% |
| 2017-2018 | 74.3% | 81.0% | 64.0% |
| 2018-2019 | 74.8% | 81.3% | 66.5% |
| 2019-2020 | 74.9% | 80.2% | 65.6% |
| 2020-2021 | 74.6% | 80.9% | 61.4% |
| 2021-2022 | 75.8% | 81.2% | 65.0% |
| 2022-2023 | 76.9% | 81.7% | 66.1% |
Overall, the data show clear structural differences in academic retention by institution type, with private nonprofit institutions maintaining a sustained advantage throughout the decade. Public institutions demonstrate steady improvement, narrowing the gap with higher-performing sectors by 2022-2023. In contrast, private for-profit institutions continue to lag, reinforcing why the average college retention rate by institution type remains a critical lens for understanding undergraduate outcomes and informing discussions around undergraduate retention and graduation rates.
While overall retention rates in higher education vary across institution types, examining first-year retention rates specifically at 4-year institutions highlights sector-specific patterns in student persistence.
Retention rate in U.S. four-year institutions (2012-2023)
The chart presents university retention rates for public, private nonprofit, and private for-profit 4-year institutions from 2012-2013 through 2022-2023. These trends illustrate differences in higher educational student retention across sectors and provide insight into the percentage of students returning for their sophomore year at long-term degree-granting institutions.

- Public 4-year institutions maintained strong higher ed retention, rising from 79.9% in 2012-2013 to 82.1% in 2022-2023.
- Private nonprofit 4-year colleges maintained consistently high first-year retention, reaching 81.8% in 2022-2023, closely aligned with public institutions at 82.1%.
- Private for-profit 4-year institutions continued to have the lowest university retention rates, fluctuating between 52.7% and 62.8% over the decade.
First-year student retention in 4-year colleges
| Year | Public institutions, % | Private nonprofit institutions, % | Private for-profit institutions, % |
| 2012-2013 | 79.9% | 80.6% | 52.7% |
| 2017-2018 | 81.2% | 81.2% | 59.7% |
| 2018-2019 | 81.5% | 81.5% | 62.8% |
| 2019-2020 | 82.4% | 80.5% | 62.6% |
| 2020-2021 | 80.8% | 81.1% | 61.7% |
| 2021-2022 | 81.2% | 81.3% | 62.6% |
| 2022-2023 | 82.1% | 81.8% | 61.3% |
Across 4-year institutions, the data show a persistent advantage in academic retention for private nonprofit and public institutions, with private for-profit colleges lagging significantly. Public institutions show steady growth in first-year retention rate, while private nonprofit colleges maintain a consistently high level, demonstrating sector-based disparities in average college retention rate by institution type. These patterns highlight the importance of institution type when analyzing student retention rates in higher education.
While overall first-year retention rates vary by institution type, student persistence also differs significantly across racial and ethnic groups, highlighting equity considerations in student retention rates in higher education.
First-year retention rates in 4-year institutions by race (2015-2023)
The chart illustrates the first-year student persistence rate by demographic for 4-year institutions from 2015 through 2023. It compares retention outcomes for Asian, Black, Hispanic, International, Multiracial, Native American, Native Hawaiian/Pacific Islander, and White students, showing how college persistence rates by race differ over time.

- Asian students consistently had the highest retention, with 87.33% retained in 2023, compared with other racial groups.
- Black students showed the lowest retention rates throughout the period, declining from 69.32% in 2015 to 67.68% in 2023.
- Retention for Hispanic students remained relatively stable, averaging around 74% in 2023, while International students fluctuated between 68.75% and 80.95% over the years.
Racial disparities in 4-year college student retention
| Entering cohort year | Asian, % | Black, % | Hispanic, % | International, % | Multiracial, % | Native American, % | Native Hawaiian/Pacific Islander, % | White, % |
| 2015 | 87.04% | 69.32% | 75.43% | 68.75% | 75.24% | 77.04% | 67.80% | 72.18% |
| 2016 | 86.99% | 69.08% | 75.44% | 72.80% | 76.95% | 77.13% | 69.52% | 71.32% |
| 2017 | 86.99% | 68.42% | 75.06% | 74.47% | 76.81% | 76.70% | 67.69% | 70.35% |
| 2018 | 86.99% | 68.28% | 75.21% | 74.78% | 77.88% | 76.97% | 65.60% | 67.61% |
| 2019 | 86.22% | 70.43% | 76.04% | 72.24% | 77.15% | 76.54% | 63.71% | 71.29% |
| 2020 | 87.79% | 65.78% | 72.16% | 80.95% | 79.11% | 75.85% | 58.55% | 65.06% |
| 2021 | 87.28% | 65.02% | 73.43% | 77.09% | 80.39% | 76.41% | 61.34% | 63.95% |
| 2022 | 86.61% | 66.74% | 73.72% | 73.86% | 80.59% | 76.79% | 61.39% | 66.24% |
| 2023 | 87.33% | 67.68% | 74.46% | 73.44% | 79.98% | 77.65% | 62.48% | 67.13% |
Retention rates in 4-year institutions reveal clear disparities across racial and ethnic groups. Asian and Native American students consistently show higher persistence, whereas Black and Native Hawaiian/Pacific Islander students have lower retention, highlighting ongoing gaps in college persistence rates by race. These differences underscore the need for targeted strategies in higher ed student retention to ensure equitable outcomes for all demographic groups.
Beyond racial and ethnic differences, student retention rates in higher education also vary by age, reflecting distinct challenges for younger and older first-year students.
First-year retention rates in 4-year institutions by age (2015-2023)
This chart presents first-year student persistence rate by demographic, showing retention trends in 4-year institutions by age groups: 20 or younger, 21-24, and 25 or older. The data highlights how younger students typically demonstrate higher college persistence rates, while older students face steeper retention challenges.

- Students aged 20 or younger consistently show the highest retention, reaching 74.47% in 2023.
- Students aged 21-24 have lower retention, at 48.31% in 2023, reflecting nearly a 26 percentage point gap compared to the youngest cohort.
- Students 25 or older show the lowest and most stable retention, around 46%, with minimal changes from 2015 to 2023.
How age impacts college retention in 4-year institutions
| Entering cohort year | 20 or Younger, % | 21-24, % | 25 or Older, % |
| 2015 | 72.30% | 45.40% | 49.31% |
| 2016 | 72.58% | 45.50% | 49.39% |
| 2017 | 72.69% | 45.91% | 48.75% |
| 2018 | 72.85% | 46.11% | 47.83% |
| 2019 | 77.63% | 45.53% | 46.66% |
| 2020 | 71.36% | 50.32% | 47.26% |
| 2021 | 72.50% | 46.85% | 46.08% |
| 2022 | 73.31% | 46.32% | 46.44% |
| 2023 | 74.47% | 48.31% | 46.16% |
Age is a significant factor in higher ed student retention, with younger students far more likely to persist into their second year. Mid-aged and older first-year students face lower retention rates, highlighting the need for age-sensitive support programs. These differences emphasize that strategies to improve college retention rates should consider age alongside institutional type and demographic characteristics.
While 4-year institutions often show higher retention, retention rates in higher education are notably lower in 2-year institutions, highlighting sector-specific challenges for first-year students.
First-year retention rates in 2-year institutions (2012-2023)
This chart shows college retention rates for first-time undergraduates at 2-year institutions, broken down by institution type: public, private nonprofit, and private for-profit. The data demonstrates differences in higher ed student retention across these sectors, providing insight into where students are more likely to continue their studies.

- Public 2-year institutions saw retention improve from 59.3% in 2012-2013 to 64.5% in 2022-2023.
- Private nonprofit 2-year colleges consistently maintain higher retention than public counterparts, reaching 72.2% in 2022-2023.
- Private for-profit 2-year colleges show more fluctuation but end at 69.3% retention in 2022-2023, slightly above public institutions.
How retention varies across 2-year colleges
| Year | Public institutions, % | Private nonprofit institutions, % | Private for-profit institutions, % |
| 2012-2013 | 59.3% | 58.9% | 67.7% |
| 2017-2018 | 61.9% | 71.8% | 66.0% |
| 2018-2019 | 62.5% | 73.9% | 68.3% |
| 2019-2020 | 60.7% | 66.0% | 67.4% |
| 2020-2021 | 61.1% | 65.4% | 61.2% |
| 2021-2022 | 62.8% | 72.3% | 66.5% |
| 2022-2023 | 64.5% | 72.2% | 69.3% |
Retention in 2-year institutions is generally lower than in 4-year colleges, with public 2-year institutions consistently lagging behind private nonprofit and for-profit colleges. The differences indicate that institutional type strongly influences student retention rates in higher education, and tailored strategies may be needed to support students in public community colleges.
Examining overall retention by institution type reveals differences by gender, showing that student retention rates in higher education vary not only by institution but also by demographic characteristics.
First-year retention in 2-year colleges by gender (2015-2023)
This chart highlights the college retention rates for first-time undergraduates in 2-year institutions, separated by gender. It shows that female students consistently return at higher rates than male students, reflecting broader trends in higher ed student retention.

- Female students in 2-year institutions had higher retention than males every year, reaching 56.37% in 2023.
- Male students’ retention fluctuated more, with a low of 49.37% in 2019 and rising to 53.69% in 2023.
- The retention gap between genders ranged from ~2 to 6 percentage points, consistently favoring female students.
Gender differences in 2-year college retention rates
| Entering cohort year | Male, % | Female, % |
| 2015 | 52.08% | 55.56% |
| 2016 | 54.42% | 55.67% |
| 2017 | 52.06% | 56.10% |
| 2018 | 52.92% | 56.59% |
| 2019 | 49.37% | 55.51% |
| 2020 | 51.75% | 54.72% |
| 2021 | 53.20% | 55.34% |
| 2022 | 54.40% | 56.45% |
| 2023 | 53.69% | 56.37% |
Retention in 2-year institutions shows a persistent gender gap, with females more likely to continue into their second year. These patterns highlight the importance of considering gender-specific strategies to improve student retention rates in higher education, particularly for male students in public and private 2-year colleges.
Beyond gender differences, retention in 2-year institutions also varies significantly across racial groups, revealing patterns in student retention rates in higher education.
First-year retention in 2-year colleges by race (2015-2023)
This chart presents retention rates for first-time undergraduates in 2-year institutions by race. It shows notable differences among racial groups, with college retention rates highest for Asian students and generally lower for Black and Native American students, illustrating persistent equity challenges in higher ed student retention.

- Asian students consistently had the highest retention, peaking at 66.90% in 2018.
- Black students had the lowest retention across most years, reaching 46.40% in 2021.
- Retention among White students remained relatively stable, around 56.36% in 2015 and 57.54% in 2023.
Racial disparities in 2-year college retention rates
| Entering cohort year | Asian, % | Black, % | Hispanic, % | International, % | Multiracial, % | Native American, % | Native Hawaiian/Pacific Islander, % | White, % |
| 2015 | 65.39% | 44.81% | 57.70% | 54.57% | 52.91% | 46.84% | 50.17% | 56.36% |
| 2016 | 66.48% | 45.41% | 57.50% | 40.56% | 52.22% | 48.08% | 53.40% | 56.63% |
| 2017 | 66.43% | 44.29% | 56.61% | 59.40% | 52.66% | 46.82% | 47.44% | 56.40% |
| 2018 | 66.90% | 45.10% | 57.30% | 57.38% | 53.43% | 46.71% | 49.42% | 56.86% |
| 2019 | 65.80% | 44.63% | 53.60% | 60.35% | 51.89% | 45.61% | 46.67% | 55.28% |
| 2020 | 65.48% | 45.88% | 55.16% | 60.05% | 51.68% | 47.25% | 47.51% | 54.66% |
| 2021 | 64.52% | 46.40% | 56.58% | 58.78% | 53.36% | 48.29% | 50.41% | 56.54% |
| 2022 | 66.00% | 46.19% | 56.94% | 62.04% | 54.78% | 48.78% | 51.13% | 57.74% |
| 2023 | 65.84% | 45.70% | 56.45% | 62.01% | 56.21% | 46.81% | 47.61% | 57.54% |
Retention in 2-year institutions highlights persistent racial disparities. Asian students show the strongest continuation into the second year, while Black and Native American students lag, emphasizing the need for targeted interventions to improve student retention rates in higher education across underrepresented racial groups.
In addition to racial disparities, age plays a significant role in student retention rates in higher education, with younger students generally returning at higher rates than older cohorts.
First-year retention in 2-year colleges by age group (2015-2023)
This chart illustrates retention rates for first-time undergraduates in 2-year institutions by age. Students aged 20 or younger consistently exhibit higher retention compared with those aged 21-24 or 25 and older, highlighting challenges in supporting older learners in higher ed student retention.

- Students 20 or younger had the highest retention, reaching 58.50% in 2023.
- Students aged 21-24 experienced moderate retention, increasing from 42.34% in 2015 to 47.20% in 2023.
- Retention among students 25 or older remained the lowest, dropping to 40.01% in 2023.
Age-based differences in 2-year college retention rates
| Entering cohort year | 20 or Younger, % | 21-24, % | 25 or Older, % |
| 2015 | 57.00% | 42.34% | 43.12% |
| 2016 | 57.11% | 43.56% | 43.20% |
| 2017 | 56.43% | 44.04% | 45.41% |
| 2018 | 57.21% | 44.87% | 45.04% |
| 2019 | 55.16% | 41.93% | 41.16% |
| 2020 | 55.18% | 43.75% | 44.78% |
| 2021 | 57.11% | 44.53% | 42.40% |
| 2022 | 58.29% | 45.86% | 42.71% |
| 2023 | 58.50% | 47.20% | 40.01% |
Retention in 2-year institutions decreases with age, with younger students showing stronger persistence into the second year. These trends underline the importance of age-sensitive interventions to improve higher ed student retention, especially for non-traditional and older learners.
While retention in 4-year institutions varies by age, race, and gender, student retention in community colleges faces unique challenges, with a notable share of students leaving before completing their first year.
What percent of community college students drop out after the first year?
Community college persistence and first-year non-return rates (2012-2023)
This chart shows first-year persistence and non-return rates for U.S. community college students. Overall, community college retention rates have gradually improved, with a decreasing share of students leaving before the second year. The data highlight the ongoing issues of attrition in college and the student attrition rate specific to two-year institutions.

- The community college persistence rate increased from 59.3% in 2012-2013 to 64.5% in 2022-2023.
- The non-return rate declined from 40.7% in 2012-2013 to 35.5% in 2022-2023, reflecting improved student follow-through.
- The largest drop in non-return occurred between 2019-2020 (39.3%) and 2022-2023 (35.5%), showing a 3.8 percentage point improvement.
Tracking retention and dropout in U.S. community colleges
| Year | Community college persistence rate, % | Community college non-return rate, % |
| 2012-2013 | 59.3% | 40.7% |
| 2017-2018 | 61.9% | 38.1% |
| 2018-2019 | 62.5% | 37.5% |
| 2019-2020 | 60.7% | 39.3% |
| 2020-2021 | 61.1% | 38.9% |
| 2021-2022 | 62.8% | 37.2% |
| 2022-2023 | 64.5% | 35.5% |
Although first-year attrition remains high, community colleges have made gradual progress in student retention in community colleges. Persistent non-return rates indicate ongoing challenges, emphasizing the need for targeted support and interventions to help students transition successfully into their second year.
Beyond retention rates, understanding shifts in total college enrollment helps contextualize persistence in higher education and the challenges institutions face in maintaining student numbers.
U.S. college enrollment trends and sector-wide decline
Trends in U.S. college enrollment (1985-2023)
This chart displays total U.S. college enrollment over nearly four decades, broken down by 4-year institutions and 2-year institutions. The data reveal long-term growth through the 2000s, followed by a decline in total enrollments after 2011, highlighting trends in student persistence and national enrollment dynamics.

- Total U.S. college enrollment peaked at 18,082,427 students in 2010 before declining to 15,399,866 in 2022.
- Enrollment in 2-year institutions dropped from 5,948,104 in 2000 to 4,658,368 in 2022, showing a significant shift in community college participation.
- 4-year institutions maintained more stable numbers, growing from 6,065,597 in 1985 to 11,109,174 in 2023, reflecting sustained interest in bachelor’s programs.
Historical enrollment patterns in U.S. higher education
| Year | Total, persons | 4-year institutions, persons | 2-year institutions, persons |
| 1985 | 10,596,674 | 6,065,597 | 4,531,077 |
| 1986 | 10,797,975 | 6,118,427 | 4,679,548 |
| 1987 | 11,046,235 | 6,270,013 | 4,776,222 |
| 1988 | 11,316,548 | 6,441,393 | 4,875,155 |
| 1989 | 11,742,531 | 6,591,642 | 5,150,889 |
| 1990 | 11,959,106 | 6,719,023 | 5,240,083 |
| 1991 | 12,439,287 | 6,787,387 | 5,651,900 |
| 1992 | 12,537,700 | 6,815,351 | 5,722,349 |
| 1993 | 12,323,959 | 6,758,398 | 5,565,561 |
| 1994 | 12,262,608 | 6,732,999 | 5,529,609 |
| 1995 | 12,231,719 | 6,739,621 | 5,492,098 |
| 1996 | 12,326,948 | 6,764,168 | 5,562,780 |
| 1997 | 12,450,587 | 6,845,018 | 5,605,569 |
| 1998 | 12,436,937 | 6,947,623 | 5,489,314 |
| 1999 | 12,739,445 | 7,086,189 | 5,653,256 |
| 2000 | 13,155,393 | 7,207,289 | 5,948,104 |
| 2001 | 13,715,610 | 7,465,081 | 6,250,529 |
| 2002 | 14,257,077 | 7,727,879 | 6,529,198 |
| 2003 | 14,480,364 | 7,986,502 | 6,493,862 |
| 2004 | 14,780,630 | 8,235,060 | 6,545,570 |
| 2005 | 14,963,964 | 8,476,138 | 6,487,826 |
| 2006 | 15,179,591 | 8,666,288 | 6,513,303 |
| 2007 | 15,613,540 | 8,984,604 | 6,628,936 |
| 2008 | 16,344,592 | 9,373,645 | 6,970,947 |
| 2009 | 17,464,179 | 9,941,598 | 7,522,581 |
| 2010 | 18,082,427 | 10,398,830 | 7,683,597 |
| 2011 | 18,077,303 | 10,566,153 | 7,511,150 |
| 2012 | 17,735,638 | 10,567,798 | 7,167,840 |
| 2013 | 17,476,304 | 10,505,660 | 6,970,644 |
| 2014 | 17,294,136 | 10,579,458 | 6,714,678 |
| 2015 | 17,046,673 | 10,547,212 | 6,499,461 |
| 2016 | 16,874,649 | 10,782,231 | 6,092,418 |
| 2017 | 16,773,036 | 10,820,265 | 5,952,771 |
| 2018 | 16,616,370 | 10,863,408 | 5,752,962 |
| 2019 | 16,557,539 | 10,966,828 | 5,590,711 |
| 2020 | 15,884,559 | 10,952,879 | 4,931,680 |
| 2021 | 15,447,557 | 10,763,732 | 4,683,825 |
| 2022 | 15,399,866 | 10,741,498 | 4,658,368 |
| 2023 | 15,825,762 | 11,109,174 | 4,716,588 |
U.S. higher education has experienced notable fluctuations in total enrollment, with college enrollment statistics by university highlighting disparities between 4-year and 2-year institutions. The decline in 2-year institution enrollment suggests that persistence challenges and changing demographics may disproportionately impact community colleges. These trends emphasize the importance of monitoring both retention research and enrollment forecasts to support strategic planning and interventions.
Building on total enrollment trends, examining year-over-year enrollment changes reveals short-term fluctuations that provide insight into student persistence and institutional stability.
Year-over-year changes in U.S. college enrollment
This chart presents annual percentage changes in U.S. college enrollment for total students, 4-year institutions, and 2-year institutions. The data highlight periods of growth in the late 1980s and early 2000s, followed by declines in the 2010s, especially in 2-year institutions, reflecting shifts in persistence in higher education and broader demographic trends captured in college enrollment statistics by year.

- Total U.S. college enrollment fell by 4.06% in 2020, driven largely by a -11.79% decline in 2-year institutions amid pandemic disruptions.
- Enrollment in 4-year institutions increased by 3.42% in 2023, reversing earlier declines and showing resilience in bachelor’s degree programs.
- The sharpest growth for 2-year colleges occurred in 2009, with a 7.91% increase, compared to the 6.06% growth in 4-year institutions that same year.
Annual enrollment fluctuations across U.S. higher education
| Year | Total, % | 4-year institutions, % | 2-year institutions, % |
| 1986 | 1.90% | 0.87% | 3.28% |
| 1987 | 2.30% | 2.48% | 2.07% |
| 1988 | 2.45% | 2.73% | 2.07% |
| 1989 | 3.76% | 2.33% | 5.66% |
| 1990 | 1.84% | 1.93% | 1.73% |
| 1991 | 4.02% | 1.02% | 7.86% |
| 1992 | 0.79% | 0.41% | 1.25% |
| 1993 | -1.70% | -0.84% | -2.74% |
| 1994 | -0.50% | -0.38% | -0.65% |
| 1995 | -0.25% | 0.10% | -0.68% |
| 1996 | 0.78% | 0.36% | 1.29% |
| 1997 | 1.00% | 1.20% | 0.77% |
| 1998 | -0.11% | 1.50% | -2.07% |
| 1999 | 2.43% | 1.99% | 2.99% |
| 2000 | 3.27% | 1.71% | 5.22% |
| 2001 | 4.26% | 3.58% | 5.08% |
| 2002 | 3.95% | 3.52% | 4.46% |
| 2003 | 1.57% | 3.35% | -0.54% |
| 2004 | 2.07% | 3.11% | 0.80% |
| 2005 | 1.24% | 2.93% | -0.88% |
| 2006 | 1.44% | 2.24% | 0.39% |
| 2007 | 2.86% | 3.67% | 1.78% |
| 2008 | 4.68% | 4.33% | 5.16% |
| 2009 | 6.85% | 6.06% | 7.91% |
| 2010 | 3.54% | 4.60% | 2.14% |
| 2011 | -0.03% | 1.61% | -2.24% |
| 2012 | -1.89% | 0.02% | -4.57% |
| 2013 | -1.46% | -0.59% | -2.75% |
| 2014 | -1.04% | 0.70% | -3.67% |
| 2015 | -1.43% | -0.30% | -3.21% |
| 2016 | -1.01% | 2.23% | -6.26% |
| 2017 | -0.60% | 0.35% | -2.29% |
| 2018 | -0.93% | 0.40% | -3.36% |
| 2019 | -0.35% | 0.95% | -2.82% |
| 2020 | -4.06% | -0.13% | -11.79% |
| 2021 | -2.75% | -1.73% | -5.03% |
| 2022 | -0.31% | -0.21% | -0.54% |
| 2023 | 2.77% | 3.42% | 1.25% |
Year-over-year changes underscore the volatility in U.S. college enrollment, with 2-year institutions experiencing larger swings than 4-year programs, particularly during economic downturns or national crises. These fluctuations impact student persistence and highlight the importance of monitoring retention research alongside enrollment statistics to understand and mitigate the effects of attrition on higher education institutions.
Conclusions
U.S. college retention has shown a clear long-term improvement over the past decade, with first-year retention rates reaching their highest levels in 2022-2023. This trend indicates growing institutional effectiveness in supporting early student persistence, even as overall enrollment pressures continue to weigh on the higher education system.
Retention outcomes remain strongly stratified by institution type. Private nonprofit and public four-year institutions consistently outperform two-year and for-profit colleges, underscoring structural differences in resources, student preparation, and support systems that shape persistence across sectors.
Persistent demographic disparities reveal that gains in overall retention have not been evenly distributed. Racial gaps, particularly affecting Black and Native Hawaiian/Pacific Islander students, alongside markedly lower retention among older and non-traditional students, highlight ongoing equity challenges within U.S. higher education.
Community colleges have made gradual progress in improving first-year persistence, reducing non-return rates since the early 2010s. However, attrition remains structurally high, suggesting that retention improvements have not yet fully offset the broader enrollment declines facing the two-year sector.
When viewed alongside long-term enrollment trends, rising retention rates suggest a shift toward a smaller but more persistent student population. This pattern implies that U.S. higher education is stabilizing through improved student continuity rather than broad enrollment expansion, highlighting retention as a key metric in assessing institutional performance and policy outcomes.
Sources
- Center, NSC. “Persistence and Retention – 2025 Appendix (XLSX).” National Student Clearinghouse Research Center Home, 16 June 2025, https://nscresearchcenter.org/persistence-retention/persistenceandretention2025_appendix/. Accessed 23 December 2025.
- Retention of First-Time Degree-Seeking Undergraduates at Degree-Granting Postsecondary Institutions, by Attendance Status, Level and Control of Institution, and Percentage of Applications Accepted: Selected Years, 2012 through 2023. https://nces.ed.gov/programs/digest/d24/tables/dt24_326.30.asp. Accessed 23 December 2025.
- Total Undergraduate Fall Enrollment in Degree-Granting Postsecondary Institutions, by Attendance Status, Sex of Student, and Control and Level of Institution: Selected Years, 1970 through 2023. https://nces.ed.gov/programs/digest/d24/tables/dt24_303.70.asp. Accessed 23 December 2025.