Key findings:
The US overall dropout rate for undergraduate students is 40% in 2024.
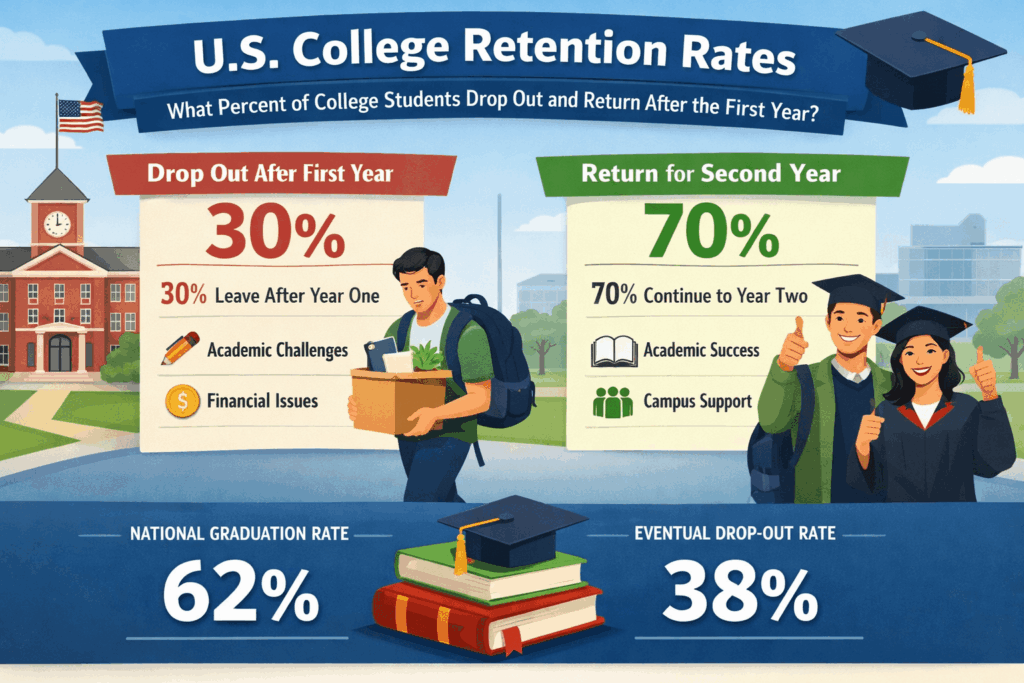
Freshman-year attrition remains high: about 1 in 4 students leave after the first year.
Financial challenges are the top driver of dropout (30%), followed by motivation (24%) and mental health (18%).
First-generation students are most at risk: 52% have considered leaving, and 41% seriously contemplated stopping out.
High school dropout rates hit a record low of 5.0% in 2022, but racial gaps persist: 7.0% of Hispanic vs. 4.1% of White and 5.7% Black students.
Computer Science shows the highest major-specific dropout rate at 10.7%, followed by Advertising, Agriculture, Art, and Architecture.
Re-enrollment remains modest: only 2-4% of students return, with Utah leading at 4.0% and Oregon lagging at 1.8%.
In 2022-23, college dropout rates ranged from 3.8% in Oregon to 9.0% in Arizona, showing strong regional disparities.
Non-graduation within 4 years at 4-year colleges declined from 66.3% in 1996 to 50.9% in 2017, reflecting improved student persistence.
Men consistently drop out within 4 years at higher rates than women, with a ~10 percentage point gender gap in 4-year institutions since the mid-1990s.
At 2-year colleges, nearly two-thirds of students fail to complete, with dropout peaking at 72.4% in 2005 before easing to 65.9% in 2019.
College dropout rates are a key measure of educational success and student persistence in higher education. Each year, a significant number of students leave college without earning a degree, influenced by factors such as financial challenges, academic difficulty, mental health issues, and personal circumstances. Understanding these trends is essential for educators, policymakers, and students themselves, as dropout patterns vary by institution type, field of study, demographic factors, and even state.
This article examines comprehensive college dropout rate statistics, including national trends, differences by gender, race, and field of study, as well as insights into why students leave and the rate of return to complete their education. By examining these data, readers can gain a clear picture of the factors driving college attrition and identify strategies to improve retention and support student success.
Dropout rate by state in the 2022-2023 academic year
The chart below highlights the share of “Some College, No Credential” students across all U.S. states in the 2022-2023 academic year. These figures reveal notable differences by geography, with certain states showing much higher dropout rates than others. Understanding these variations helps to identify where students face the greatest challenges in completing their education.
- Arizona recorded the highest dropout share at 9.0%, significantly above the national average.
- Oregon showed the lowest share at just 3.8%, indicating stronger student retention compared to most states.
- Several states, including Delaware and Idaho, had dropout rates of 8.8%, ranking them among the highest in the nation.
What percent of people drop out of college?
| State | Share of “Some College No Credential”, % |
| Alabama | 5.6% |
| Alaska | 4.6% |
| Arizona | 9.0% |
| Arkansas | 5.0% |
| California | 5.8% |
| Colorado | 5.1% |
| Connecticut | 4.3% |
| District of Columbia | 5.7% |
| Delaware | 8.8% |
| Florida | 6.2% |
| Georgia | 6.6% |
| Hawaii | 6.3% |
| Idaho | 8.8% |
| Illinois | 4.1% |
| Indiana | 4.7% |
| Iowa | 4.3% |
| Kansas | 5.8% |
| Kentucky | 4.3% |
| Louisiana | 5.8% |
| Maine | 5.8% |
| Maryland | 6.8% |
| Massachusetts | 5.0% |
| Michigan | 4.8% |
| Minnesota | 4.3% |
| Mississippi | 5.2% |
| Missouri | 4.7% |
| Montana | 5.2% |
| Nebraska | 4.7% |
| Nevada | 4.9% |
| New Hampshire | 4.9% |
| New Jersey | 4.8% |
| New Mexico | 5.2% |
| New York | 4.7% |
| North Carolina | 5.3% |
| North Dakota | 5.7% |
| Ohio | 4.4% |
| Oklahoma | 5.4% |
| Oregon | 3.8% |
| Pennsylvania | 4.5% |
| Rhode Island | 4.8% |
| South Carolina | 5.5% |
| South Dakota | 5.7% |
| Tennessee | 5.4% |
| Texas | 6.6% |
| Utah | 7.9% |
| Vermont | 5.9% |
| Virginia | 5.7% |
| Washington | 5.2% |
| West Virginia | 4.7% |
| Wisconsin | 4.9% |
| Wyoming | 5.1% |
Overall, dropout rates in 2022-2023 varied widely across the United States, ranging from under 4% to nearly 9%. Western states such as Arizona and Idaho stood out with notably high dropout shares, while states like Oregon and Illinois reported some of the lowest. These differences suggest that regional economic, social, and educational factors play a major role in shaping student persistence and completion outcomes.
To understand the broader impact of college non-completion, it is useful to examine the number of adults who have some college experience but did not earn a credential.
How many students drop out of college?
The chart below shows the number of adults under 65 with Some College No Credential (SCNC) in each U.S. state. California leads with 5,941,080 SCNC adults, followed by Texas (2,642,574) and New York (1,936,325). These figures highlight the magnitude of non-completion across the country and the potential workforce and economic implications of unfinished higher education.
- California has the largest SCNC population under 65 at 5,941,080, accounting for a significant share of the national total.
- Texas ranks second with 2,642,574 SCNC adults, showing a similarly high number of residents with some college experience but no degree.
- Smaller states such as Vermont (63,550) and South Dakota (67,808) have the lowest SCNC populations, reflecting both smaller populations and lower absolute numbers of non-completers.
Number of “Some College No Credential” under 65 by state
| State | SCNC under 65 |
| Alabama | 461,681 |
| Alaska | 93,712 |
| Arizona | 726,264 |
| Arkansas | 295,232 |
| California | 5,941,080 |
| Colorado | 623,114 |
| Connecticut | 350,307 |
| District of Columbia | 36,706 |
| Delaware | 74,167 |
| Florida | 1,606,236 |
| Georgia | 786,579 |
| Hawaii | 100,722 |
| Idaho | 183,048 |
| Illinois | 1,648,560 |
| Indiana | 716,069 |
| Iowa | 379,982 |
| Kansas | 361,334 |
| Kentucky | 564,000 |
| Louisiana | 458,711 |
| Maine | 127,925 |
| Maryland | 602,232 |
| Massachusetts | 675,920 |
| Michigan | 1,093,393 |
| Minnesota | 563,065 |
| Mississippi | 325,451 |
| Missouri | 672,518 |
| Montana | 102,764 |
| Nebraska | 254,908 |
| Nevada | 334,492 |
| New Hampshire | 94,135 |
| New Jersey | 757,282 |
| New Mexico | 264,616 |
| New York | 1,936,325 |
| North Carolina | 996,524 |
| North Dakota | 70,040 |
| Ohio | 1,274,006 |
| Oklahoma | 413,576 |
| Oregon | 675,648 |
| Pennsylvania | 1,047,644 |
| Rhode Island | 121,304 |
| South Carolina | 453,106 |
| South Dakota | 67,808 |
| Tennessee | 602,412 |
| Texas | 2,642,574 |
| Utah | 379,401 |
| Vermont | 63,550 |
| Virginia | 880,067 |
| Washington | 963,338 |
| West Virginia | 182,956 |
| Wisconsin | 629,052 |
| Wyoming | 80,854 |
The number of adults with some college education but no credential is substantial in the U.S., concentrated in highly populated states such as California, Texas, and New York. This group represents an important target for programs supporting degree completion and workforce development. Understanding these state-by-state differences can inform policymakers and educational institutions about how to allocate resources to help adults complete their education and enhance long-term economic outcomes.
While state-level dropout rates show the geographic variation, looking at long-term national trends provides a clearer picture of how persistence in higher education has evolved.
Non-graduating from 4-year institutions
Non-graduating after 4, 5, and 6 years after entry
The chart below tracks the share of students at 4-year institutions who did not graduate within four, five, and six years after entry. Covering cohorts from 1996 through 2017, the data highlights a gradual decline in dropping out of college over the past two decades. This long-term view helps assess whether college dropout rates are increasing or decreasing nationwide.

- In 1996, 66.3% of students did not graduate within four years, compared to 50.9% in 2017.
- Dropout within six years decreased from 44.6% for the 1996 cohort to 35.5% for the 2017 cohort.
- Between 2007 and 2017, the 4-year non-graduation rate fell from 60.6% to 50.9%, showing steady improvement.
Trends in non-graduation from college: 1996-2017 data
| Entry cohort | Not graduating within 4 years after entry, all | Not graduating within 5 years after entry, all | Not graduating within 6 years after entry, all |
| 1996 | 66.3% | 49.8% | 44.6% |
| 2000 | 63.9% | 47.4% | 42.4% |
| 2002 | 63.4% | 47.4% | 42.6% |
| 2003 | 63.0% | 46.8% | 42.2% |
| 2004 | 62.0% | 45.9% | 41.6% |
| 2005 | 61.7% | 45.8% | 41.4% |
| 2006 | 60.9% | 45.1% | 40.8% |
| 2007 | 60.6% | 44.9% | 40.6% |
| 2008 | 60.2% | 44.6% | 40.4% |
| 2009 | 60.1% | 44.7% | 40.6% |
| 2010 | 59.3% | 44.2% | 40.3% |
| 2011 | 58.4% | 43.4% | 39.6% |
| 2012 | 56.3% | 41.3% | 37.6% |
| 2013 | 54.7% | 40.1% | 36.6% |
| 2014 | 53.4% | 39.4% | 36.0% |
| 2015 | 52.3% | 38.6% | 35.4% |
| 2016 | 50.9% | 38.2% | 35.4% |
| 2017 | 50.9% | 38.3% | 35.5% |
Overall, the data show that the U.S. college dropout rate at 4-year institutions has steadily declined across all timeframes of completion. While around two-thirds of students in the 1990s were not graduating on time, the figure has dropped to closer to half today. These improvements suggest that institutions have become more effective in supporting degree completion, though roughly one in three students still fails to finish within six years.
Are college dropout rates increasing?
No, college dropout rate are declining over the last 20 years:
- Between the 1996 and 2017 entry cohorts, the share of students not graduating within 4 years fell from 66.3% to 50.9%, an average annual decline of about 0.73 percentage points.
- Over the same period, non-graduation within 5 years dropped from 49.8% to 38.3%, averaging a decline of 0.55 percentage points per year.
- For the standard 6-year measure, dropout rates declined from 44.6% in 1996 to 35.5% in 2017, which equals about 0.43 percentage points per year.
Beyond overall averages, it is essential to examine how the college dropout rate differs between male and female students.
Gender gap in non-graduating the college: 4-year non-graduation trends
The chart below illustrates the share of male and female students at 4-year institutions who did not graduate within four years of entry, from the 1996 through 2017 cohorts. The data reveal a persistent gender gap, with men consistently dropping out of college at higher rates than women. Over time, however, both groups show gradual improvement in on-time graduation.

- In 1996, 71.5% of men and 62.0% of women failed to graduate within four years, a gap of nearly 10 percentage points.
- By 2017, the non-graduation rate dropped to 56.6% for men and 46.2% for women, maintaining the gender gap but at lower levels overall.
- Female dropout rates declined by 15.8 percentage points between 1996 and 2017, compared to a 14.9 percentage points decrease for men.
Male vs. female non-graduating the college within four years
| Entry cohort | Not graduating within 4 years after entry, male | Not graduating within 4 years after entry, female |
| 1996 | 71.5% | 62.0% |
| 2000 | 68.9% | 59.9% |
| 2002 | 68.6% | 59.2% |
| 2003 | 67.8% | 59.0% |
| 2004 | 67.0% | 57.8% |
| 2005 | 66.5% | 57.8% |
| 2006 | 65.7% | 56.9% |
| 2007 | 65.5% | 56.5% |
| 2008 | 65.2% | 56.0% |
| 2009 | 65.3% | 55.8% |
| 2010 | 64.4% | 54.9% |
| 2011 | 63.5% | 54.1% |
| 2012 | 61.8% | 51.6% |
| 2013 | 60.3% | 50.0% |
| 2014 | 59.0% | 48.7% |
| 2015 | 57.8% | 47.7% |
| 2016 | 56.6% | 46.3% |
| 2017 | 56.6% | 46.2% |
The long-term data highlights a clear and persistent gender gap in the college dropout rate, with men more likely than women to leave without graduating on time. Both groups have seen notable progress, as the share of students not graduating within four years has fallen steadily since the mid-1990s. These trends suggest that while overall retention is improving, addressing gender-based disparities remains an important challenge for higher education institutions.
After examining four-year outcomes, the five-year data provide further insight into how male and female students differ in their college dropout rates.
Gender gap in non-graduating the college: 5-year trends
The chart below shows the percentage of male and female students at 4-year institutions who did not graduate within five years of entry, covering cohorts from 1996 through 2017. The figures indicate that while dropout rates have declined for both groups, men remain consistently more likely than women to leave college without earning a degree within five years.

- In 1996, 53.8% of men and 46.4% of women had not graduated within five years, reflecting a 7.4-point gender gap.
- By 2017, non-graduation rates fell to 42.5% for men and 35.0% for women, maintaining a similar 7.5-point difference.
- Between 1996 and 2017, the dropout rate declined by 11.3 percentage points for men and 11.4 points for women, showing nearly identical improvement.
Male vs. female non-graduating the college within five years
| Entry cohort | Not graduating within 5 years after entry, male | Not graduating within 5 years after entry, female |
| 1996 | 53.8% | 46.4% |
| 2000 | 51.0% | 44.4% |
| 2002 | 51.0% | 44.4% |
| 2003 | 50.1% | 44.1% |
| 2004 | 49.4% | 43.1% |
| 2005 | 49.1% | 43.2% |
| 2006 | 48.4% | 42.4% |
| 2007 | 48.4% | 41.9% |
| 2008 | 48.4% | 41.5% |
| 2009 | 48.5% | 41.6% |
| 2010 | 47.9% | 41.1% |
| 2011 | 47.1% | 40.3% |
| 2012 | 45.3% | 38.0% |
| 2013 | 44.1% | 36.7% |
| 2014 | 43.5% | 36.0% |
| 2015 | 42.5% | 35.3% |
| 2016 | 42.3% | 34.9% |
| 2017 | 42.5% | 35.0% |
The five-year completion data confirms a persistent gender gap in the U.S. college dropout rate, with men consistently lagging behind women in graduation outcomes. Both groups, however, demonstrate steady progress over the past two decades, with non-graduation rates dropping by more than 11 percentage points. These results suggest that while retention efforts have been effective overall, targeted strategies may still be needed to narrow the gender gap in degree completion.
Looking beyond four- and five-year outcomes, the six-year data provides the most comprehensive view of male and female college dropout rates.
Gender gap in non-graduating the college: 6-year trends
The chart below illustrates the share of male and female students at 4-year institutions who did not graduate within six years after entry, covering cohorts from 1996 through 2017. These figures show that while dropout rates have steadily declined for both groups, men consistently remain more likely than women to leave college without a degree, even over an extended timeframe.

- In 1996, 48.0% of men and 41.8% of women did not graduate within six years, a gap of 6.2 percentage points.
- By 2017, the non-graduation rate fell to 39.1% for men and 32.5% for women, preserving a 6.6-point gender difference.
- Over the two decades, male dropout rates declined by 8.9 percentage points, while female rates dropped by 9.3 points, indicating similar progress for both genders.
Male vs. female non-graduating the college within six years
| Entry cohort | Not graduating within 6 years after entry, male | Not graduating within 6 years after entry, female |
| 1996 | 48.0% | 41.8% |
| 2000 | 45.7% | 39.8% |
| 2002 | 45.6% | 40.1% |
| 2003 | 44.9% | 40.0% |
| 2004 | 44.4% | 39.3% |
| 2005 | 44.0% | 39.2% |
| 2006 | 43.5% | 38.6% |
| 2007 | 43.5% | 38.1% |
| 2008 | 43.5% | 37.7% |
| 2009 | 43.8% | 37.9% |
| 2010 | 43.5% | 37.7% |
| 2011 | 42.7% | 37.0% |
| 2012 | 41.0% | 34.7% |
| 2013 | 40.1% | 33.7% |
| 2014 | 39.5% | 33.0% |
| 2015 | 38.8% | 32.6% |
| 2016 | 38.9% | 32.5% |
| 2017 | 39.1% | 32.5% |
The six-year completion data reinforce a consistent gender gap in the college dropout rate, with men persistently less likely to graduate than women. Both male and female students, however, have benefited from long-term improvements, as overall non-graduation rates dropped steadily from the late 1990s to 2017. While retention strategies appear to be working across the board, the enduring gap suggests that gender-specific factors continue to influence college outcomes.
After analyzing 4-year institutions, it is equally important to look at dropout patterns in 2-year colleges, which serve a large share of U.S. undergraduates.
Non-graduating 2-year colleges
The chart below shows the overall non-graduation rates at 2-year institutions from the 2000 through 2019 entry cohorts. These figures highlight the challenges students face in completing shorter academic programs, with consistently higher dropout rates compared to 4-year colleges. Despite some fluctuations, the data also shows gradual signs of improvement in recent years.

- In 2005, the non-graduation rate at 2-year colleges peaked at 72.4%, the highest in the period.
- By 2018, dropout rates had declined to 65.5%, marking a notable improvement.
- The 2019 cohort recorded a 65.9% non-graduation rate, down from 69.5% in 2000.
Non-graduating from the college at 2-year institutions, 2000-2019
| Entry cohort | Not the graduation rate total |
| 2000 | 69.5% |
| 2005 | 72.4% |
| 2008 | 68.8% |
| 2009 | 69.1% |
| 2010 | 70.6% |
| 2011 | 72.1% |
| 2012 | 71.0% |
| 2013 | 69.7% |
| 2014 | 68.4% |
| 2015 | 67.7% |
| 2016 | 67.4% |
| 2017 | 66.4% |
| 2018 | 65.5% |
| 2019 | 65.9% |
Dropout rates at 2-year institutions remain significantly higher than at 4-year colleges, with roughly two-thirds of students failing to graduate within the observed timeframe. While the early 2000s saw particularly high dropout levels, the trend since 2015 indicates modest progress in student retention. These findings underscore the unique challenges faced by community colleges, where financial, academic, and personal barriers often contribute to higher dropout rates.
To better understand the dynamics at 2-year institutions, it is useful to compare how dropout rates differ between male and female students.
Gender differences in non-graduating the college
The chart below presents non-graduation rates for male and female students at 2-year colleges from the 2000 through 2019 cohorts. The data show that men consistently have higher dropout rates than women, though both groups face challenges completing shorter academic programs. Over time, both male and female rates have shown a gradual decline, reflecting modest progress in retention.

- In 2011, dropout rates peaked at 74.7% for men and 70.5% for women in 2005, the highest levels across the period.
- By 2019, the non-graduation rate had declined to 67.7% for men and 64.3% for women, narrowing the gap slightly.
- Male dropout rates fell by 3.6 percentage points between 2000 and 2019, while female rates decreased by 3.6 points as well, showing parallel improvements.
Male vs. female non-graduating the college at 2-year institutions
| Entry cohort | Not graduation rate, male | Not graduation rate, female |
| 2000 | 71.3% | 67.9% |
| 2005 | 74.6% | 70.5% |
| 2008 | 72.6% | 65.6% |
| 2009 | 72.8% | 65.9% |
| 2010 | 73.8% | 67.9% |
| 2011 | 74.7% | 70.0% |
| 2012 | 73.4% | 68.8% |
| 2013 | 72.5% | 67.2% |
| 2014 | 71.3% | 65.9% |
| 2015 | 70.4% | 65.3% |
| 2016 | 69.0% | 65.9% |
| 2017 | 68.1% | 64.8% |
| 2018 | 67.4% | 63.7% |
| 2019 | 67.7% | 64.3% |
The data confirms a persistent gender gap in college dropout rates at 2-year institutions, with men more likely than women to leave without a credential. Although both groups show modest declines over time, overall dropout levels remain high, affecting nearly two-thirds of students. These results highlight the ongoing challenges community colleges face in supporting student persistence and the need for targeted strategies to address both general and gender-specific barriers to completion.
Beyond long-term graduation rates, it is also important to examine how many students leave college after their very first year.
Average college dropout rate: 2024 statistics
College completion rates vary widely depending on the type of institution. Private nonprofit four-year colleges report the highest graduation rates at around 76%, while public four-year institutions follow closely at 71%. In contrast, for-profit four-year schools have significantly lower graduation outcomes, with fewer than 36% of students completing their degrees. Looking at two-year programs, completion rates are much lower overall: public colleges show 30.2%, private nonprofits 56.2%, and private for-profits 55.2%, with an overall average of 34.1% for all two-year colleges.
- When averaged across institution types, the college dropout rate in 2024 is about 40%, meaning roughly 6 in 10 students eventually complete their program.
First-year and first-time dropout rates
What percentage of college freshmen drop out?
The chart below shows the percentage of first-year students who drop out after their freshman year across all U.S. institutions. These figures provide insight into early student retention challenges, often considered the most critical period for persistence in higher education. Tracking how many freshmen drop out of college also helps explain broader patterns in completion rates.

- In 2006, 29% of first-year students dropped out after their freshman year, the highest level in the series.
- By 2018, the dropout rate had declined to 23.8%, marking the lowest point across the observed years.
- In 2020, the rate was 24.4%, showing relative stability compared to the mid-2010s.
Freshman college dropout rate by year
| Year | Drop out, % |
| 2006 | 29.0% |
| 2009 | 28.1% |
| 2015 | 24.7% |
| 2016 | 24.5% |
| 2017 | 24.4% |
| 2018 | 23.8% |
| 2019 | 24.1% |
| 2020 | 24.4% |
The data indicate that roughly one in four freshmen fail to return for their sophomore year, underscoring the importance of targeted support for first-year students. While the percentage of college students who drop out after the first year has declined since the mid-2000s, the rate has stabilized in recent years, suggesting a persistent challenge. Improving retention during the freshman year remains crucial, as early dropout strongly influences overall college completion outcomes.
While overall freshman dropout rates are important, breaking them down by institution type reveals striking differences in student retention.
Percentage of first-year students who drop out after their first year, 4-year institutions
The chart below compares the percentage of first-year students who drop out after their freshman year at 4-year public, nonprofit private, and for-profit private colleges. These figures highlight how institutional type plays a major role in early student success, with for-profit schools showing dramatically higher dropout rates than their public and nonprofit counterparts.

What percent of college students drop out?
- In 2006, the freshman dropout rate was 22.0% at public colleges, 20.6% at nonprofit private colleges, and a much higher 54.6% at for-profit colleges.
- By 2019, for-profit institutions improved to 36.8%, but remained about double the rates of public (17.6%) and nonprofit private (19.5%).
- In 2020, public colleges reported 19.2%, nonprofit private 18.9%, while for-profits still had 38.3%, underscoring a persistent gap.
Freshman dropout rate by institution type: 4-year colleges
| Year | Public | Non-profit private | For-profit private |
| 2006 | 22.0% | 20.6% | 54.6% |
| 2009 | 20.4% | 20.0% | 46.2% |
| 2015 | 18.9% | 18.5% | 44.3% |
| 2016 | 18.7% | 18.6% | 45.7% |
| 2017 | 18.8% | 18.8% | 40.3% |
| 2018 | 18.5% | 18.5% | 37.2% |
| 2019 | 17.6% | 19.5% | 36.8% |
| 2020 | 19.2% | 18.9% | 38.3% |
What percentage of college students drop out after the first year?
- In 2020, 19.2% of public college students dropped out.
- In 2020, 18.9% of non-profit private college students dropped out.
- In 2020, 38.3% of for-profit private college students dropped out.
The data shows that the type of institution significantly influences the likelihood of freshmen dropping out after their first year. Public and nonprofit private colleges consistently maintain dropout rates under 20%, while for-profit colleges struggle with rates nearly twice as high. Although for-profits have seen improvement since the mid-2000s, they remain the sector with the greatest retention challenges, raising concerns about student outcomes and educational equity.
Examining first-year dropout rates at 2-year institutions reveals a different pattern compared to 4-year colleges, with generally higher rates across all institution types.
Percentage of first-year students who drop out after their first year, 2-year institutions
The chart below presents the percentage of first-year students who dropped out after their freshman year at 2-year public, nonprofit private, and for-profit colleges from 2006 through 2020. These figures illustrate how community colleges and other 2-year institutions face persistent retention challenges, with dropout rates often exceeding one-third of students.

- In 2006, 41.0% of students at public 2-year colleges left after their first year, compared to 37.9% at nonprofit private and 35.1% at for-profit private institutions.
- By 2018, the public 2-year dropout rate had declined to 37.5%, while nonprofit private institutions fell to 26.1% and for-profit colleges to 31.7%.
- In 2020, dropout rates were 39.0% at public, 34.7% at nonprofit private, and 37.3% at for-profit 2-year institutions, showing modest fluctuations over time.
Freshman dropout rate by institution type: 2-year colleges
| Year | Public | Nonprofit private | For-profit private |
| 2006 | 41.0% | 37.9% | 35.1% |
| 2009 | 40.1% | 41.0% | 32.8% |
| 2015 | 38.0% | 33.3% | 34.2% |
| 2016 | 37.9% | 33.3% | 33.1% |
| 2017 | 38.1% | 28.2% | 34.0% |
| 2018 | 37.5% | 26.1% | 31.7% |
| 2019 | 39.5% | 31.9% | 32.6% |
| 2020 | 39.0% | 34.7% | 37.3% |
Overall, first-year dropout rates at 2-year institutions are substantially higher than at 4-year colleges, affecting roughly one-third to over 40% of students, depending on institution type. Public 2-year colleges consistently show the highest rates, while nonprofit private schools generally perform better in retaining freshmen. These trends underscore the challenges faced by students in shorter programs and highlight the need for targeted support during the critical first year of college.
To further understand long-term outcomes, it is important to examine the share of students who are no longer enrolled six years after starting college.
Percentage of students no longer enrolled, 4-year institutions
Percentage of students no longer enrolled 6 years after entry, by gender
The chart below shows the percentage of male and female students at 4-year institutions who were no longer enrolled six years after entry, for the 2011 and 2016 cohorts. These figures highlight how persistence differs by gender even in long-term college enrollment, with men more likely than women to leave without completing their degree.

- In 2011, 27.7% of men and 22.7% of women were no longer enrolled six years after entry.
- By 2016, the non-enrollment rate declined to 23.7% for men and 18.3% for women, reflecting improved persistence.
Gender differences in 4-year college non-enrollment after six years
| Entry cohort | Male | Female |
| 2011 | 27.7% | 22.7% |
| 2016 | 23.7% | 18.3% |
The data indicate that even six years after entry, a significant share of students at 4-year colleges are no longer enrolled, with men consistently showing higher non-enrollment rates than women. Both genders have experienced modest improvements between the 2011 and 2016 cohorts. These trends suggest that long-term persistence has increased slightly, but targeted efforts may still be needed to ensure students complete their degrees.
Beyond gender differences, analyzing six-year non-enrollment rates by race reveals important disparities in long-term college persistence.
Percentage of students no longer enrolled 6 years after entry, by race
The chart below presents the percentage of students no longer enrolled six years after entry at 4-year institutions, broken down by racial group for the 2011 and 2016 cohorts. The data highlights clear disparities, with American Native and Black students experiencing the highest non-enrollment rates, while Asian and White students generally show the lowest.

College dropout rates by race
- In 2011, 42.0% of American Native and 39.1% of Black students were no longer enrolled six years after entry, the highest among all racial groups.
- Asian students consistently had the lowest non-enrollment rates, with 15.0% in 2011 and 11.6% in 2016.
- From 2011 to 2016, non-enrollment decreased across all groups, with Hispanic students dropping from 28.2% to 24.6% and White students from 21.8% to 18.0%.
Racial differences in students no longer enrolled six years after entry
| Entry cohort | American native | Asian | Black | Hispanic | Pacific islander | White | Two or more races |
| 2011 | 42.0% | 15.0% | 39.1% | 28.2% | 36.4% | 21.8% | 28.6% |
| 2016 | 34.6% | 11.6% | 32.4% | 24.6% | 32.3% | 18.0% | 23.9% |
The data reveal persistent racial disparities in college persistence at 4-year institutions. Students from American Native and Black backgrounds are most likely to leave without completing their degree, while Asian and White students show stronger retention. Although all groups experienced improvements between 2011 and 2016, these differences underscore the ongoing need for policies and support systems that address racial inequities in higher education outcomes.
In addition to long-term trends at 4-year colleges, it is important to examine how quickly students leave 2-year institutions, particularly within the first few years.
Percentage of students no longer enrolled, 2-year institutions
Percentage of students no longer enrolled 3 years after entry, by gender
The chart below shows the percentage of male and female students no longer enrolled three years after entry at 2-year institutions for the 2014 and 2019 cohorts. The data highlights a consistent gender gap, with men more likely than women to leave without completing a credential.

- In 2014, 44.7% of men and 38.2% of women were no longer enrolled three years after entry.
- By 2019, non-enrollment rates increased slightly to 46.6% for men and 41.8% for women.
- Over the five years, the gender gap remained around 5 percentage points, showing persistent disparity in retention.
Male vs. female students are no longer enrolled after three years
| Entry cohort | Male | Female |
| 2014 | 44.7% | 38.2% |
| 2019 | 46.6% | 41.8% |
Overall, non-enrollment rates at 2-year institutions remain high, affecting nearly half of male students within three years. Although both male and female students face challenges, men are consistently more likely to leave without completing their program. These findings highlight the need for targeted support and intervention strategies to improve retention, particularly for male students in community colleges and other 2-year programs.
Beyond gender differences, analyzing non-enrollment by race at 2-year institutions reveals significant disparities in early college persistence.
Percentage of students no longer enrolled 3 years after entry, by race
The chart below shows the percentage of students no longer enrolled three years after entry at 2-year institutions, broken down by racial group for the 2014 and 2019 cohorts. The data highlights that American Native, Black, and Pacific Islander students consistently experience the highest non-enrollment rates, while Asian and White students generally have lower rates of leaving without completing their program.

College dropout rates by race
- In 2014, 48.7% of American Native and 48.4% of Black students were no longer enrolled after three years, the highest among all racial groups.
- By 2019, non-enrollment rose for Pacific Islander students to 54.3%, the largest increase across all groups.
- Asian students consistently had the lowest rates, with 30.1% in 2014 and 30.5% in 2019, showing minimal change.
Racial differences in students no longer enrolled after three years
| Entry cohort | American native | Asian | Black | Hispanic | Pacific islander | White | Two or more races |
| 2014 | 48.7% | 30.1% | 48.4% | 42.5% | 41.3% | 38.8% | 45.9% |
| 2019 | 51.0% | 30.5% | 53.1% | 47.2% | 54.3% | 39.7% | 47.1% |
The data indicate substantial racial disparities in retention at 2-year institutions. Students from American Native, Black, and Pacific Islander backgrounds are most likely to leave college within three years, while Asian and White students demonstrate stronger persistence. Although some groups, such as Asian students, show stable retention, overall non-enrollment has increased for several high-risk groups, emphasizing the need for targeted support and interventions to improve equity in early college outcomes.
Understanding dropout rates requires exploring the underlying reasons why students leave college before completing their degree.
Reasons for dropping out the college
Why students leave college: financial, motivational, and mental health challenges
The chart below shows the main reasons students report for dropping out of college. Financial challenges, motivation or life circumstances, and mental health issues emerge as the leading factors influencing students’ decisions to leave. Examining these reasons helps identify where institutions can focus their support efforts to reduce dropout rates.

- 30% of students cited financial challenges as the primary reason for leaving college, confirming that financial pressure is a main reason for college dropout.
- 24% of students dropped out due to motivation or life challenges, highlighting non-academic barriers to persistence.
- 18% reported mental health challenges as the reason for leaving, showing the growing importance of emotional and psychological support on campus.
Financial pressure is a main reason for college dropout
| Reason | Percentage of responses, % |
| Financial challenges | 30% |
| Motivation or life challenges | 24% |
| Mental health challenges | 18% |
Financial difficulties are the leading cause of college dropout, affecting nearly one-third of students. In addition, life circumstances and mental health challenges play a significant role, together accounting for over 40% of dropout cases. Addressing these issues through targeted financial aid, counseling, and student support programs is essential to improving retention and helping more students complete their degrees.
Financial challenges are the most frequently cited reason students leave college, and understanding the specific costs involved provides a clearer picture of the barriers to completion.
What percent of students don’t go to college because of money?
The chart below shows the breakdown of financial reasons why students drop out of college. Both tuition and living expenses, including books, housing, and food, play a major role in students’ decisions to leave, highlighting the significant economic pressures faced by many undergraduates.

- 53% of students cited the cost of tuition as a key reason for dropping out.
- 50% reported books, living costs, and food as contributing factors to their decision to leave college.
How tuition and living costs contribute to college dropout
| Reason | Percentage of responses, % |
| Cost of tuition | 53% |
| Cost of books, living costs, and food | 50% |
Financial pressures remain the dominant factor in college dropout, with tuition and basic living costs creating significant barriers to degree completion. These findings emphasize the importance of financial aid, scholarships, and support programs to help students manage expenses and remain enrolled. Without addressing these economic challenges, a large share of students will continue to leave college before earning a degree.
First-generation college students face unique challenges that make them more likely than their peers to consider leaving college before completing a degree.
First-generation students who had considered leaving college
The chart below shows the percentage of first-generation students who had considered leaving college at some point. More than half of respondents considered stopping out, and a significant portion seriously contemplated leaving, highlighting the vulnerability of this group to dropout. Understanding these statistics is critical for institutions aiming to support students most at risk of dropping out of college.

- 52% of first-generation students reported considering leaving college at some point.
- 41% were seriously considering stopping out, indicating high levels of uncertainty about persistence.
- These figures emphasize that first-generation students are among those most at risk of dropping out of college.
Dropout risk among first-generation college students
| Considering leaving college | Percentage of responses, % |
| Considering leaving college at some point | 52% |
| Seriously considering stopping out | 41% |
First-generation college students show elevated intentions to leave college, with more than half thinking about stopping out and over 40% seriously considering it. These statistics underscore the importance of targeted academic, financial, and social support for this population. Addressing the specific barriers faced by first-generation students can help reduce the first-generation college student dropout rate and improve overall college completion outcomes.
To understand why first-generation students are at higher risk of leaving college, it is important to examine the specific factors that contribute to their decisions to stop out.
Reasons for leaving college
The chart below shows the main reasons first-generation students leave college compared to their peers. Mental health challenges and living away from home affect students differently, with first-generation students reporting higher impacts from these factors. This data helps clarify why first-generation students are more vulnerable to dropping out than other student groups.

- 58% of first-generation students cited mental health as a reason for leaving college, compared to 44% of peers.
- 25% of first-generation students reported living away from home as a factor, more than double the 11% of peers.
- These results indicate that first-generation students face disproportionately higher challenges related to mental health and adjustment to campus life.
Key factors influencing first-generation college student dropout
| Reasons for leaving college | First-gen students | Peers |
| Mental health | 58% | 44% |
| Living away from home | 25% | 11% |
First-generation students encounter unique pressures that increase their likelihood of leaving college. Mental health challenges and adjusting to living away from home are more significant for first-generation students than for their peers. Targeted support services addressing these areas, such as counseling, mentoring, and residential guidance, can help reduce the first-generation college student dropout rate and improve retention outcomes.
Before analyzing college dropout patterns, it is important to examine trends in high school completion, since high school graduation is a key predictor of college enrollment and success.
High school dropout rate
High school dropout rate trends in the U.S., 1967-2022
The chart below shows the average high school dropout rate in the U.S. from 1967 through 2022. Over this period, the percentage of students dropping out of school has steadily declined, reflecting improvements in educational policies, access, and retention efforts. These trends also help explain changes in the pool of students entering college and the overall percentage of students who go to college.

- In 1967, the high school dropout rate was 17.0%, the highest recorded in this dataset.
- By 2000, the rate had fallen to 10.9%, showing a nearly 6-point decrease over three decades.
- In 2022, the dropout rate reached a historic low of 5.0%, indicating that fewer students are leaving high school without a diploma than ever before.
High school dropout rate by year: historical data
| Year | Dropout rate, % |
| 1967 | 17.0% |
| 1968 | 16.2% |
| 1969 | 15.2% |
| 1970 | 15.0% |
| 1971 | 14.7% |
| 1972 | 14.6% |
| 1973 | 14.1% |
| 1974 | 14.3% |
| 1975 | 13.9% |
| 1976 | 14.1% |
| 1977 | 14.1% |
| 1978 | 14.2% |
| 1979 | 14.6% |
| 1980 | 14.1% |
| 1981 | 13.9% |
| 1982 | 13.9% |
| 1983 | 13.7% |
| 1984 | 13.1% |
| 1985 | 12.6% |
| 1986 | 12.2% |
| 1987 | 12.6% |
| 1988 | 12.9% |
| 1989 | 12.6% |
| 1990 | 12.1% |
| 1991 | 12.5% |
| 1992 | 11.0% |
| 1993 | 11.0% |
| 1994 | 11.4% |
| 1995 | 12.0% |
| 1996 | 11.1% |
| 1997 | 11.0% |
| 1998 | 11.8% |
| 1999 | 11.2% |
| 2000 | 10.9% |
| 2001 | 10.7% |
| 2002 | 10.5% |
| 2003 | 9.9% |
| 2004 | 10.3% |
| 2005 | 9.4% |
| 2006 | 9.3% |
| 2007 | 8.7% |
| 2008 | 8.0% |
| 2009 | 8.1% |
| 2010 | 7.4% |
| 2011 | 7.1% |
| 2012 | 6.6% |
| 2013 | 6.8% |
| 2014 | 6.5% |
| 2015 | 5.9% |
| 2016 | 6.1% |
| 2017 | 5.8% |
| 2018 | 5.7% |
| 2019 | 5.2% |
| 2020 | 5.3% |
| 2021 | 5.1% |
| 2022 | 5.0% |
The data demonstrates a long-term decline in high school dropout rates in the United States. Fewer students are leaving school early, which contributes to higher percentages of students enrolling in college. However, students who do drop out of high school face long-term economic disadvantages, as they typically earn less than their peers who complete their education. Understanding these trends is essential for addressing educational inequality and supporting students at risk of dropping out.
Examining dropout rates by race provides deeper insight into which student groups are most at risk of leaving high school without a diploma.
High school dropout rate by race in the U.S., 1967-2022
The chart below shows high school dropout rates for Black, Hispanic, and White students from 1967 through 2022. The data highlights significant racial disparities over time, with Black and Hispanic students historically experiencing higher dropout rates than White students. While all groups have seen declines, the gap between racial groups persists.

- In 1967, 28.6% of Black students and 15.4% of White students dropped out, showing a large racial gap.
- Hispanic students experienced the highest dropout rate in 1988 at 35.8%, compared to 9.6% of White students.
- By 2022, dropout rates had decreased to 5.7% for Black, 7.0% for Hispanic, and 4.1% for White students, reflecting overall progress but ongoing disparities.
Racial disparities in high school dropout rates
| Year | Black | Hispanic | White |
| 1967 | 28.6% | N/A | 15.4% |
| 1968 | 27.4% | N/A | 14.7% |
| 1969 | 26.7% | N/A | 13.6% |
| 1970 | 27.9% | N/A | 13.2% |
| 1971 | 24.0% | N/A | 13.4% |
| 1972 | 21.3% | 34.3% | 12.3% |
| 1973 | 22.2% | 33.5% | 11.6% |
| 1974 | 21.2% | 33.0% | 11.9% |
| 1975 | 22.9% | 29.2% | 11.4% |
| 1976 | 20.5% | 31.4% | 12.0% |
| 1977 | 19.8% | 33.0% | 11.9% |
| 1978 | 20.2% | 33.3% | 11.9% |
| 1979 | 21.1% | 33.8% | 12.0% |
| 1980 | 19.1% | 35.2% | 11.4% |
| 1981 | 18.4% | 33.2% | 11.3% |
| 1982 | 18.4% | 31.7% | 11.4% |
| 1983 | 18.0% | 31.6% | 11.1% |
| 1984 | 15.5% | 29.8% | 11.0% |
| 1985 | 15.2% | 27.6% | 10.4% |
| 1986 | 14.2% | 30.1% | 9.7% |
| 1987 | 14.1% | 28.6% | 10.4% |
| 1988 | 14.5% | 35.8% | 9.6% |
| 1989 | 13.9% | 33.0% | 9.4% |
| 1990 | 13.2% | 32.4% | 9.0% |
| 1991 | 13.6% | 35.3% | 8.9% |
| 1992 | 13.7% | 29.4% | 7.7% |
| 1993 | 13.6% | 27.5% | 7.9% |
| 1994 | 12.6% | 30.0% | 7.7% |
| 1995 | 12.1% | 30.0% | 8.6% |
| 1996 | 13.0% | 29.4% | 7.3% |
| 1997 | 13.4% | 25.3% | 7.6% |
| 1998 | 13.8% | 29.5% | 7.7% |
| 1999 | 12.6% | 28.6% | 7.3% |
| 2000 | 13.1% | 27.8% | 6.9% |
| 2001 | 10.9% | 27.0% | 7.3% |
| 2002 | 11.3% | 25.7% | 6.5% |
| 2003 | 10.9% | 23.5% | 6.3% |
| 2004 | 11.8% | 23.8% | 6.8% |
| 2005 | 10.4% | 22.4% | 6.0% |
| 2006 | 10.7% | 22.1% | 5.8% |
| 2007 | 8.4% | 21.4% | 5.3% |
| 2008 | 9.9% | 18.3% | 4.8% |
| 2009 | 9.3% | 17.6% | 5.2% |
| 2010 | 8.0% | 15.1% | 5.1% |
| 2011 | 7.3% | 13.6% | 5.0% |
| 2012 | 7.5% | 12.7% | 4.3% |
| 2013 | 7.3% | 11.75% | 5.1% |
| 2014 | 7.4% | 10.6% | 5.2% |
| 2015 | 6.5% | 9.2% | 4.6% |
| 2016 | 6.2% | 8.6% | 5.2% |
| 2017 | 5.7% | 9.5% | 4.6% |
| 2018 | 5.8% | 9.0% | 4.5% |
| 2019 | 5.6% | 7.5% | 4.5% |
| 2020 | 4.2% | 7.4% | 4.8% |
| 2021 | 3.9% | 8.2% | 4.4% |
| 2022 | 5.7% | 7.0% | 4.1% |
High school dropout rates have declined across all racial groups over the past five decades. However, disparities remain, with Black and Hispanic students historically more likely to leave school without graduating. Understanding these trends is crucial for addressing educational inequality and informing policies to support at-risk students, improve graduation rates, and increase the percentage of students who go to college.
Understanding how dropout rates vary by field of study highlights which majors pose the greatest challenges for student persistence.
Majors with the highest dropout rate
Top 5 fields of study by dropout rate
The chart below presents the top five fields of study with the highest college dropout rates. Students in certain majors face more rigorous coursework, financial pressures, or other challenges that may contribute to leaving college without completing their degree. Tracking these rates helps identify where targeted academic and support interventions may be most needed.

- Computer Science has the highest dropout rate at 10.7%, making it the major with the most students leaving before graduation.
- Advertising and Agriculture follow, with dropout rates of 7.7% and 7.4%, respectively.
- Art and Architecture have slightly lower rates, 7.3%, and 7.2%, but still rank among the top five majors with the highest dropout rate.
Dropout rates by field of study: top 5 majors
| Field of study | Dropout rate |
| Computer science | 10.7% |
| Advertising | 7.7% |
| Agriculture | 7.4% |
| Art | 7.3% |
| Architecture | 7.2% |
Dropout rates differ significantly by field of study, with STEM and creative majors like Computer Science and Architecture showing elevated risks. These differences reflect both academic rigor and other external pressures that affect student retention. Understanding which majors have the highest dropout rate can guide universities in providing targeted support and resources to help students complete their programs, particularly in high-risk disciplines such as computer science.
While dropout rates show which students leave college, re-enrollment rates reveal how many students return to continue their education after stopping out.
Returning to college
Re-enrollment rate by state
The chart below shows re-enrollment rates by state, highlighting the share of students who return to college after a period of absence. Rates vary across states, with some, like Utah (4.0%) and Maryland (3.9%), showing higher re-enrollment, while others, including Oregon (1.8%) and Connecticut, Iowa, and Minnesota (1.9%), remain lower. Understanding these trends helps identify where adult learners and former students are most likely to resume their studies.
- Utah has the highest re-enrollment rate at 4.0%, indicating strong return-to-college activity.
- Oregon has the lowest re-enrollment rate at 1.8%, showing fewer students return after dropping out.
- Most states have re-enrollment rates between 2-3%, suggesting that a relatively small but meaningful portion of former students return to complete their education.
Re-enrollment rates by state: students returning to college
| State | Re-enrollment rate, % |
| Alabama | 2.9% |
| Alaska | 2.5% |
| Arizona | 3.9% |
| Arkansas | 2.6% |
| California | 2.9% |
| Colorado | 2.3% |
| Connecticut | 1.9% |
| District of Columbia | 2.7% |
| Delaware | 3.5% |
| Florida | 2.8% |
| Georgia | 3.3% |
| Hawaii | 2.7% |
| Idaho | 3.5% |
| Illinois | 2.0% |
| Indiana | 2.4% |
| Iowa | 1.9% |
| Kansas | 2.7% |
| Kentucky | 2.5% |
| Louisiana | 2.7% |
| Maine | 2.3% |
| Maryland | 3.9% |
| Massachusetts | 2.5% |
| Michigan | 2.4% |
| Minnesota | 1.9% |
| Mississippi | 2.8% |
| Missouri | 2.3% |
| Montana | 2.1% |
| Nebraska | 2.2% |
| Nevada | 2.2% |
| New Hampshire | 2.2% |
| New Jersey | 2.3% |
| New Mexico | 2.9% |
| New York | 2.2% |
| North Carolina | 2.7% |
| North Dakota | 2.1% |
| Ohio | 2.1% |
| Oklahoma | 2.6% |
| Oregon | 1.8% |
| Pennsylvania | 2.0% |
| Rhode Island | 2.6% |
| South Carolina | 2.9% |
| South Dakota | 2.3% |
| Tennessee | 2.3% |
| Texas | 3.1% |
| Utah | 4.0% |
| Vermont | 2.6% |
| Virginia | 2.7% |
| Washington | 2.0% |
| West Virginia | 2.2% |
| Wisconsin | 2.3% |
| Wyoming | 2.1% |
Re-enrollment rates highlight the opportunities and challenges for students returning to college, including adult learners or those who previously dropped out. While overall percentages are modest, states like Utah and Maryland demonstrate that targeted support and programs can encourage students to return. These data are relevant for anyone considering going back to college at 40 or older, as they reflect trends in adults returning to college and the pathways available for older college students.
Conclusions
- By 2023, college dropout patterns revealed deep structural challenges in U.S. higher education, with overall rates improving since the 1990s but still leaving millions without degrees.
- The decline in non-graduation at 4-year colleges from 66.3% in 1996 to 50.9% in 2017 shows progress, yet nearly one in three students still fails to graduate within six years.
- The burden is uneven: men, first-generation, and minority students face significantly higher dropout risks. Gender gaps remain around 10 percentage points, and racial disparities persist, with Black, Hispanic, and Native students most affected.
- Financial strain is the most decisive factor: a third of dropouts cite financial challenges, while mental health and life challenges add further pressure, particularly for first-generation students.
- Despite improvements, early attrition remains critical: roughly one in four freshmen leaves after the first year, shaping long-term outcomes and reinforcing inequities across institution types.
- Re-enrollment trends show only modest recovery, with just 2-4% of former students returning. This highlights both lost potential and the importance of targeted support for adult learners.
- Looking ahead, narrowing gender, racial, and socioeconomic gaps while addressing affordability and mental health will be central to reducing dropout rates and ensuring broader access to college completion.
Sources
- Baldwin, Tom. “College Dropout Rates Statistics 2025 (New Data LIVE).” Coursmos, 29 July 2025, https://www.coursmos.com/college-dropout-statistics/. Accessed 26 August 2025.
- Genevieve Carlton, Ph. D. Update. “Should You Drop Out of College? | BestColleges.” BestColleges.Com, 21 Jan. 2026, https://www.bestcolleges.com/blog/dropping-out-of-college/. Accessed 26 August 2025.
- Graduation Rate from First Institution Attended for First-Time, Full-Time Bachelor’s Degree-Seeking Students at 4-Year Postsecondary Institutions, by Race/Ethnicity, Time to Completion, Sex, Control of Institution, and Percentage of Applications Accepted: Selected Cohort Entry Years, 1996 through 2017. https://nces.ed.gov/programs/digest/d24/tables/dt24_326.10.asp. Accessed 26 August 2025.
- Graduation Rate from First Institution Attended within 150 Percent of Normal Time for First-Time, Full-Time Degree/Certificate-Seeking Students at 2-Year Postsecondary Institutions, by Race/Ethnicity, Sex, and Control of Institution: Selected Cohort Entry Years, 2000 through 2019. https://nces.ed.gov/programs/digest/d23/tables/dt23_326.20.asp. Accessed 26 August 2025.
- Jessica BryantUpdated on January 25, 2024Edited. “College Dropout Rate in the U.S. | BestColleges.” Bestcolleges.Com, 25 Jan. 2026, https://www.bestcolleges.com/research/college-dropout-rate/. Accessed 26 August 2025.
- Mowreader, Ashley. “Why College Students Drop out of School and What Can Help.” Inside Higher Ed | Higher Education News, Events and Jobs, 9 Sept. 2025, https://www.insidehighered.com/news/student-success/health-wellness/2024/04/18/why-college-students-drop-out-school-and-what-can. Accessed 26 August 2025.
- Percentage Distribution of First-Time, Full-Time Bachelor’s Degree-Seeking Students at 4-Year Postsecondary Institutions 6 Years after Entry, by Completion and Enrollment Status at First Institution Attended, Sex, Race/Ethnicity, Control of Institution, and Percentage of Applications Accepted: Cohort Entry Years 2011 and 2016. https://nces.ed.gov/programs/digest/d23/tables/dt23_326.15.asp. Accessed 26 August 2025.
- Percentage Distribution of First-Time, Full-Time Degree/Certificate-Seeking Students at 2-Year Postsecondary Institutions 3 Years after Entry, by Completion and Enrollment Status at First Institution Attended, Sex, Race/Ethnicity, and Control of Institution: Cohort Entry Years 2014 and 2019. https://nces.ed.gov/programs/digest/d23/tables/dt23_326.25.asp. Accessed 26 August 2025.
- Percentage of High School Dropouts among Persons 16 to 24 Years Old (Status Dropout Rate), by Sex and Race/Ethnicity: Selected Years, 1960 through 2022. https://nces.ed.gov/programs/digest/d23/tables/dt23_219.70.asp. Accessed 26 August 2025.
- “Some College, No Credential.” National Student Clearinghouse Research Center Home, 4 June 2025, https://nscresearchcenter.org/some-college-no-credential/. Accessed 26 August 2025.