Key findings:
Over 4.7 million students graduate from U.S. colleges in 2024, nearly doubling since the early 2000s, with bachelor’s degrees making up about 65% of all awards
36.4% of Americans hold a bachelor’s degree or higher, but attainment varies widely from 24.4% in West Virginia to 65.5% in the District of Columbia.
The average 6-year college graduation rate reached 63.6% for the 2017 entry year, up from 55.4% for the 1996 entry year, while 49.1% of students completed their degree within four years.
STEM majors account for 21.6% of bachelor’s degrees, rising sharply since the 1970s, while business remains the top field at 18.6%.
7.26% of Americans now hold a master’s degree, almost double the share in 2001, making it the fastest-growing advanced qualification.
Graduation rates vary by race and gender: Asian students lead at 60.9%, while women graduate at higher rates than men (59.1% vs. 40.9% at the bachelor’s level in 2023-24).
Education plays a key role in shaping the U.S. workforce, economy, and overall quality of life. Over the past few decades, the share of Americans with a college degree has grown steadily, reflecting broader access to higher education and the increasing importance of advanced qualifications in today’s job market. But what percentage of Americans actually holds a college degree, and how has that number changed over time? In this article, we’ll explore the latest data on educational attainment in the United States, including how many Americans have associate, bachelor’s, and graduate degrees, how trends differ by age, gender, and race, and what these numbers reveal about the nation’s evolving educational landscape.
How many people graduate from college every year in the U.S.?
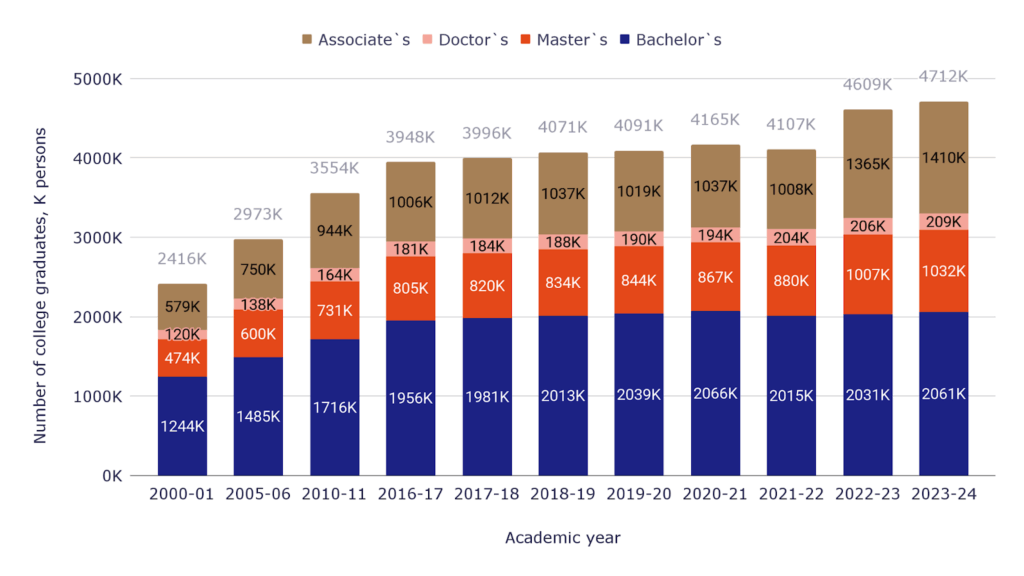
Every year, millions of students in the United States graduate from colleges and universities, joining the country’s growing pool of educated professionals.
- The total number of U.S. college graduates increased from 2.4 million in 2000-2001 to over 4.7 million in 2023-24.
- Bachelor’s degrees remain the dominant qualification, representing about 44% of all graduates in 2023-24.
- The bachelor’s degrees conferred grew by 65.6% since the early 2000s, while associate degrees account for 29.9% of all U.S. graduates.
Number of college graduates per year in the USA: trends and insights
Overall, the data highlights a steady rise in the number of college graduates per year in the USA, driven by expanding access to higher education and growing demand for skilled labor. Despite some fluctuations, the long-term trend shows consistent growth across all degree levels: bachelor’s, master’s, and doctoral. With 4.7 million Americans earning a degree each year, the U.S. continues to maintain one of the world’s largest and most dynamic academic systems, reflecting both economic opportunity and cultural emphasis on education.
While the number of college graduates continues to rise each year, it’s equally important to understand how this translates into the overall educational attainment of the U.S. population.
Percent of Americans with a bachelor’s degree or higher
The share of Americans holding a bachelor’s degree or higher has reached record levels, reflecting decades of investment in higher education and workforce development. As of 2024 data, the percentage of Americans with a bachelor’s degree stands above one in three adults. However, the rates vary significantly across states: from less than 25% in West Virginia to more than 65% in the District of Columbia. The chart below shows the percentage of the U.S. population with a college degree by state.
- The percentage of Americans with a bachelor’s degree or higher is 36,4%.
- The District of Columbia tops the list with 65.5% of residents holding at least a bachelor’s degree, making it the most educated area in the country.
- States like Massachusetts (48.3%), Colorado (47.8%), and Vermont (45.1%) rank among the top 10 most educated states, showing strong concentrations of college-educated populations.
- At the lower end, West Virginia (24.4%), Mississippi (27.0%), and Arkansas (27.1%) have the smallest share of adults with higher education, highlighting ongoing regional disparities in educational attainment by state.
Percentage of the U.S. population with a bachelor’s degree or higher by state
| State | Percentage, % |
| Alabama | 29.9% |
| Alaska | 32.8% |
| Arizona | 34.7% |
| Arkansas | 27.1% |
| California | 38.1% |
| Colorado | 47.8% |
| Connecticut | 42.6% |
| Delaware | 36.0% |
| District of Columbia | 65.5% |
| Florida | 35.8% |
| Georgia | 36.3% |
| Hawaii | 37.8% |
| Idaho | 33.0% |
| Illinois | 39.2% |
| Indiana | 30.7% |
| Iowa | 32.1% |
| Kansas | 36.0% |
| Kentucky | 27.9% |
| Louisiana | 27.8% |
| Maine | 37.1% |
| Maryland | 44.7% |
| Massachusetts | 48.3% |
| Michigan | 33.3% |
| Minnesota | 40.0% |
| Mississippi | 27.0% |
| Missouri | 33.5% |
| Montana | 36.3% |
| Nebraska | 35.4% |
| Nevada | 28.5% |
| New Hampshire | 41.5% |
| New Jersey | 44.5% |
| New Mexico | 31.8% |
| New York | 41.2% |
| North Carolina | 37.1% |
| North Dakota | 34.0% |
| Ohio | 32.4% |
| Oklahoma | 29.3% |
| Oregon | 37.8% |
| Pennsylvania | 36.4% |
| Rhode Island | 39.0% |
| South Carolina | 33.3% |
| South Dakota | 34.2% |
| Tennessee | 32.4% |
| Texas | 35.2% |
| Utah | 39.1% |
| Vermont | 45.1% |
| Virginia | 43.3% |
| Washington | 41.0% |
| West Virginia | 24.4% |
| Wisconsin | 34.6% |
| Wyoming | 32.3% |
The data reveals clear geographic differences in the percentage of Americans with a college degree, reflecting variations in state economies, access to universities, and demographic factors. Overall, 36,4% of the U.S. population holds a bachelor’s degree or higher. States with strong technology, healthcare, and education sectors, such as Massachusetts, Maryland, and Colorado, tend to have the highest percentage of Americans with graduate degrees, while southern and rural states lag. These trends underline the growing importance of higher education in shaping regional prosperity and workforce competitiveness across the United States.
After reviewing the share of Americans who hold a degree, it’s equally important to understand how many students actually complete their college programs and how graduation rates have changed over time.
U.S. 4-year college graduation rate by year: trends and progress
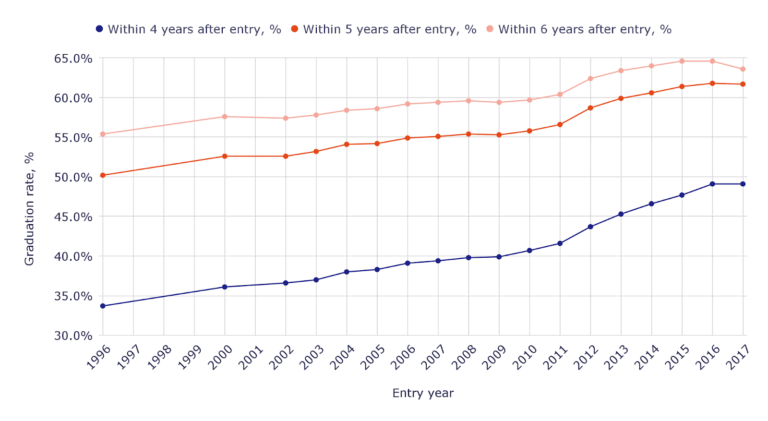
The average college graduation rate in the United States has steadily improved over the past two decades, reflecting both institutional efforts to support students and changing academic expectations. Nationally, about 64% of students complete their college degree within six years, while only 49% graduate within four years, which is the traditional time frame for a bachelor’s program. The chart below tracks the college completion rates from the mid-1990s through the 2010s, showing gradual but consistent gains across cohorts.
- The graduation rate within six years increased from 55.4% for the 1996 cohort to 63.6% for the 2017 cohort, showing nearly an 8 percentage point improvement in two decades.
- The 4-year graduation rate rose from 33.7% for the 1996 entry year to 49.1% for the 2017 entry year, meaning almost one in two students now completes a bachelor’s degree on time.
Average 4-year college graduation rate over time in the United States
| Entry year | Within 4 years after entry, % | Within 5 years after entry, % | Within 6 years after entry, % |
| 1996 | 33.7% | 50.2% | 55.4% |
| 2000 | 36.1% | 52.6% | 57.6% |
| 2002 | 36.6% | 52.6% | 57.4% |
| 2003 | 37.0% | 53.2% | 57.8% |
| 2004 | 38.0% | 54.1% | 58.4% |
| 2005 | 38.3% | 54.2% | 58.6% |
| 2006 | 39.1% | 54.9% | 59.2% |
| 2007 | 39.4% | 55.1% | 59.4% |
| 2008 | 39.8% | 55.4% | 59.6% |
| 2009 | 39.9% | 55.3% | 59.4% |
| 2010 | 40.7% | 55.8% | 59.7% |
| 2011 | 41.6% | 56.6% | 60.4% |
| 2012 | 43.7% | 58.7% | 62.4% |
| 2013 | 45.3% | 59.9% | 63.4% |
| 2014 | 46.6% | 60.6% | 64.0% |
| 2015 | 47.7% | 61.4% | 64.6% |
| 2016 | 49.1% | 61.8% | 64.6% |
| 2017 | 49.1% | 61.7% | 63.6% |
What is the average graduation rate for colleges?
- The average graduation rate for colleges is 63.6% within 6 years after entry.
What percentage of college students graduate in 4 years?
- 49.1% of college students graduate within 4 years after entry.
Over the past two decades, U.S. college graduation rates have shown a clear upward trend. The share of students completing a bachelor’s degree within four years increased from 33.7% in 1996 to 49.1% in 2017, while 5- and 6-year completion rates also rose steadily, reaching 61.7% and 64.6%, respectively. This improvement indicates that more students are graduating on time or within a slightly extended timeframe, reflecting enhanced academic support, preparation, and institutional efforts to help students complete their degrees efficiently. Overall, the data demonstrates a gradual but consistent increase in college completion rates across the country.
While graduation rates indicate the percentage of students who eventually earn their degrees, retention rates reveal how effectively colleges support students’ academic progress from year to year.
4-year college retention rate in the U.S.: how many students stay in school?
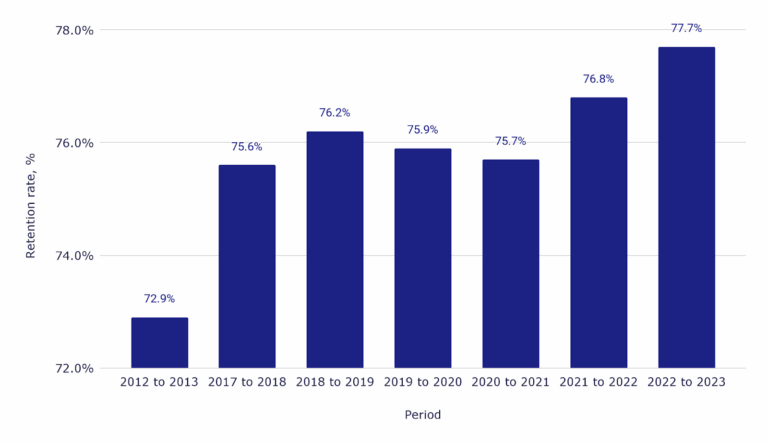
The college retention rate measures the percentage of first-year students who return to the same institution for their second year, a key indicator of academic persistence and institutional effectiveness. Across U.S. universities, the retention rate currently stands at about 78%, meaning nearly four out of five students continue their studies beyond the first year. The data below tracks college retention rates by year, highlighting a gradual improvement from 72.9% in 2012-2013 to 77.7% in 2022-2023.
- The national college retention rate increased from 72.9% in 2012-2013 to 77.7% in 2022-2023, showing a steady rise of nearly 5 percentage points over the last decade.
Trends in U.S. university retention rates and student persistence
| Period | Retention rate, % |
| 2012 to 2013 | 72.9% |
| 2017 to 2018 | 75.6% |
| 2018 to 2019 | 76.2% |
| 2019 to 2020 | 75.9% |
| 2020 to 2021 | 75.7% |
| 2021 to 2022 | 76.8% |
| 2022 to 2023 | 77.7% |
Overall, the upward trend in college retention rates suggests that more students are staying enrolled and successfully progressing through their programs. Improved academic advising, better campus resources, and increased focus on mental health and financial aid have likely contributed to these gains.
After examining graduation and retention trends, the next step is to explore what students are actually studying and how the distribution of bachelor’s degrees has evolved across different fields over time.
Most popular college majors in the U.S.: bachelor’s degrees by field of study
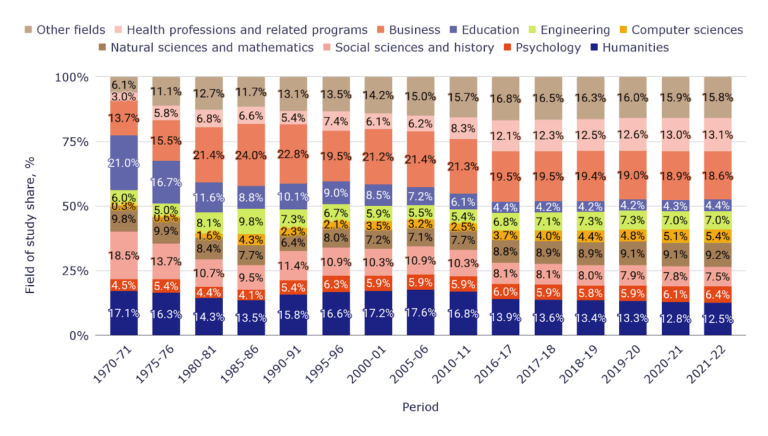
The composition of U.S. bachelor’s degrees has shifted considerably over the past five decades, reflecting changing economic priorities, labor market demands, and student interests. Business remains the most popular major in the U.S., consistently accounting for around 19% of all bachelor’s degrees. Meanwhile, college graduates with STEM degrees, including computer science, natural sciences, and engineering, now make up about 21.6% of all graduates, a figure that continues to rise as technology-driven careers expand.
- The share of business majors among bachelor’s graduates remains high at 18.6% in 2021-22, confirming business as the most popular major in the U.S..
- STEM fields (science, technology, engineering, and mathematics) collectively reached 21.6% of all college graduates, with computer science degrees growing from just 0.3% in 1970-71 to 5.4% in 2021-22.
- Education degrees dropped sharply from 21% in the early 1970s to only 4.4% in 2021-22, showing a long-term decline in students choosing teaching-related careers.
College major statistics: distribution of bachelor’s degrees by discipline
| Academic year | Humanities | Psychology | Social sciences and history | Natural sciences and mathematics | Computer sciences | Engineering | Education | Business | Health professions and related programs | Other fields |
| 1970-71 | 17.1% | 4.5% | 18.5% | 9.8% | 0.3% | 6.0% | 21.0% | 13.7% | 3.0% | 6.1% |
| 1975-76 | 16.3% | 5.4% | 13.7% | 9.9% | 0.6% | 5.0% | 16.7% | 15.5% | 5.8% | 11.1% |
| 1980-81 | 14.3% | 4.4% | 10.7% | 8.4% | 1.6% | 8.1% | 11.6% | 21.4% | 6.8% | 12.7% |
| 1985-86 | 13.5% | 4.1% | 9.5% | 7.7% | 4.3% | 9.8% | 8.8% | 24.0% | 6.6% | 11.7% |
| 1990-91 | 15.8% | 5.4% | 11.4% | 6.4% | 2.3% | 7.3% | 10.1% | 22.8% | 5.4% | 13.1% |
| 1995-96 | 16.6% | 6.3% | 10.9% | 8.0% | 2.1% | 6.7% | 9.0% | 19.5% | 7.4% | 13.5% |
| 2000-01 | 17.2% | 5.9% | 10.3% | 7.2% | 3.5% | 5.9% | 8.5% | 21.2% | 6.1% | 14.2% |
| 2005-06 | 17.6% | 5.9% | 10.9% | 7.1% | 3.2% | 5.5% | 7.2% | 21.4% | 6.2% | 15.0% |
| 2010-11 | 16.8% | 5.9% | 10.3% | 7.7% | 2.5% | 5.4% | 6.1% | 21.3% | 8.3% | 15.7% |
| 2016-17 | 13.9% | 6.0% | 8.1% | 8.8% | 3.7% | 6.8% | 4.4% | 19.5% | 12.1% | 16.8% |
| 2017-18 | 13.6% | 5.9% | 8.1% | 8.9% | 4.0% | 7.1% | 4.2% | 19.5% | 12.3% | 16.5% |
| 2018-19 | 13.4% | 5.8% | 8.0% | 8.9% | 4.4% | 7.3% | 4.2% | 19.4% | 12.5% | 16.3% |
| 2019-20 | 13.3% | 5.9% | 7.9% | 9.1% | 4.8% | 7.3% | 4.2% | 19.0% | 12.6% | 16.0% |
| 2020-21 | 12.8% | 6.1% | 7.8% | 9.1% | 5.1% | 7.0% | 4.3% | 18.9% | 13.0% | 15.9% |
| 2021-22 | 12.5% | 6.4% | 7.5% | 9.2% | 5.4% | 7.0% | 4.4% | 18.6% | 13.1% | 15.8% |
Over time, the percentage of degrees by major has reflected broader transformations in the American economy. As technology and data-driven industries expanded, STEM disciplines have seen continuous growth, while traditional fields such as the humanities and education have steadily declined. Business and health-related programs remain dominant, together accounting for more than 30% of all bachelor’s degrees conferred in recent years. These trends show a clear shift toward practical, career-oriented education pathways, a sign of how U.S. students are aligning their academic choices with evolving job market demands.
After looking at bachelor’s degree trends, it’s worth exploring how graduate education in the U.S. has evolved, particularly which master’s programs have attracted the most students in recent decades.
Most popular college majors in the U.S.: master’s degrees by field of study
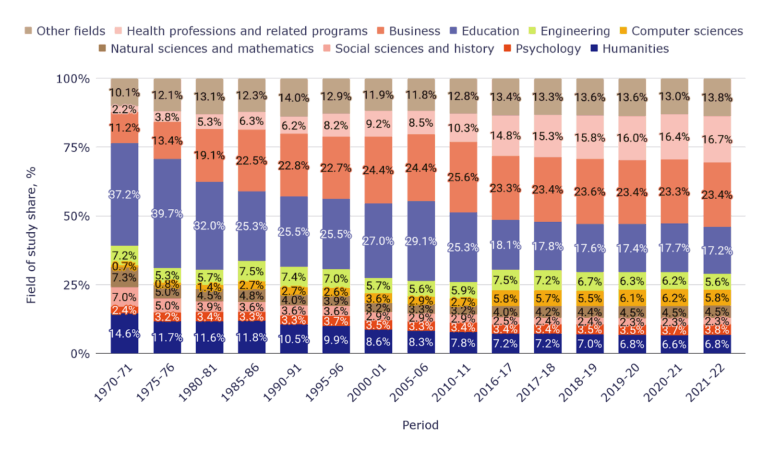
Master’s degrees represent one of the fastest-growing segments of higher education in the United States. Historically dominated by education and business, the master’s landscape has gradually diversified as more students pursue STEM-related fields and professional specializations.
- Education was a major field at the master’s level, but its share has declined from 37.2% in 1970-71 to 17.2% in 2021-22, reflecting a shift toward other professional and technical programs.
- Business master’s degrees have steadily grown, increasing from 11.2% in the early 1970s to 23.4% in 2021-22, confirming business as one of the most popular graduate majors in the U.S.
- STEM fields together now account for nearly 15.9% of all master’s graduates, compared with 15.2% five decades ago.
College major statistics: distribution of master’s degrees by discipline
| Academic year | Humanities | Psychology | Social sciences and history | Natural sciences and mathematics | Computer sciences | Engineering | Education | Business | Health professions and related programs | Other fields |
| 1970-71 | 14.6% | 2.4% | 7.0% | 7.3% | 0.7% | 7.2% | 37.2% | 11.2% | 2.2% | 10.1% |
| 1975-76 | 11.7% | 3.2% | 5.0% | 5.0% | 0.8% | 5.3% | 39.7% | 13.4% | 3.8% | 12.1% |
| 1980-81 | 11.6% | 3.4% | 3.9% | 4.5% | 1.4% | 5.7% | 32.0% | 19.1% | 5.3% | 13.1% |
| 1985-86 | 11.8% | 3.3% | 3.6% | 4.8% | 2.7% | 7.5% | 25.3% | 22.5% | 6.3% | 12.3% |
| 1990-91 | 10.5% | 3.3% | 3.6% | 4.0% | 2.7% | 7.4% | 25.5% | 22.8% | 6.2% | 14.0% |
| 1995-96 | 9.9% | 3.7% | 3.6% | 3.9% | 2.6% | 7.0% | 25.5% | 22.7% | 8.2% | 12.9% |
| 2000-01 | 8.6% | 3.5% | 2.9% | 3.2% | 3.6% | 5.7% | 27.0% | 24.4% | 9.2% | 11.9% |
| 2005-06 | 8.3% | 3.3% | 2.9% | 3.3% | 2.9% | 5.6% | 29.1% | 24.4% | 8.5% | 11.8% |
| 2010-11 | 7.8% | 3.4% | 2.9% | 3.2% | 2.7% | 5.9% | 25.3% | 25.6% | 10.3% | 12.8% |
| 2016-17 | 7.2% | 3.4% | 2.5% | 4.0% | 5.8% | 7.5% | 18.1% | 23.3% | 14.8% | 13.4% |
| 2017-18 | 7.2% | 3.4% | 2.4% | 4.2% | 5.7% | 7.2% | 17.8% | 23.4% | 15.3% | 13.3% |
| 2018-19 | 7.0% | 3.5% | 2.4% | 4.4% | 5.5% | 6.7% | 17.6% | 23.6% | 15.8% | 13.6% |
| 2019-20 | 6.8% | 3.5% | 2.3% | 4.5% | 6.1% | 6.3% | 17.4% | 23.4% | 16.0% | 13.6% |
| 2020-21 | 6.6% | 3.7% | 2.3% | 4.5% | 6.2% | 6.2% | 17.7% | 23.3% | 16.4% | 13.0% |
| 2021-22 | 6.8% | 3.8% | 2.3% | 4.5% | 5.8% | 5.6% | 17.2% | 23.4% | 16.7% | 13.8% |
Over the past five decades, the distribution of master’s degrees in the U.S. has shifted significantly. Education, once the largest share, has gradually declined, while business and health-related fields have steadily grown. Computer sciences have increased modestly, reflecting growing demand in technology, whereas engineering, humanities, social sciences, and natural sciences have generally declined or remained relatively stable. Overall, the trend shows a move toward professional and applied degrees, with more graduates pursuing careers in business, health, and STEM, especially computing.
Following the trends observed at the master’s level, doctoral education in the United States highlights a continued shift toward professional and research-intensive fields, particularly in health, STEM, and education.
Most popular college majors in the U.S.: doctoral degrees by field of study
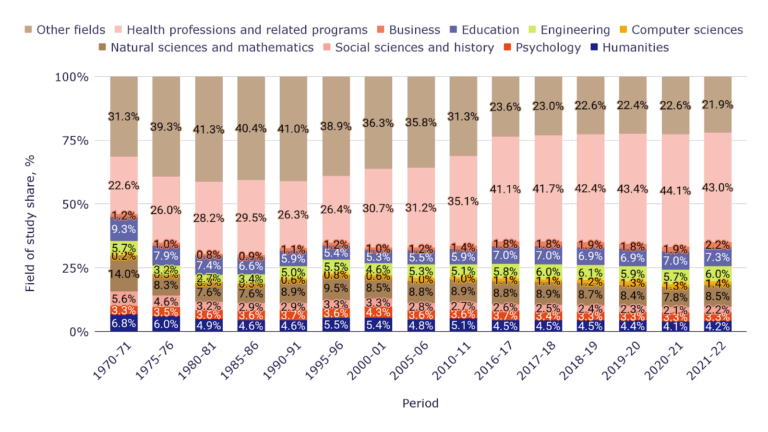
Doctoral degrees in the U.S. show a clear concentration in health professions, which account for 43% of all doctorates in 2021-22, up from 22.6% in 1970-71. Meanwhile, fields such as natural sciences, engineering, and computer sciences have steadily expanded, reflecting the broader rise in college graduates with STEM degrees (15.9%). Although education doctorates remain an important pathway for academic and administrative careers, their share has declined compared to earlier decades. These trends reveal how the percentage of degrees by major continues to evolve across advanced academic levels in the U.S.
- Health professions dominate doctoral education, rising from 22.6% in 1970-71 to 43.0% in 2021-22, making it one of the most popular majors in the U.S. at the doctoral level.
- Education doctorates account for 7.3% of all doctor’s degrees, showing a modest rebound after decades of decline, while business doctorates remain limited at just 2.2% despite business being one of the most popular majors in the U.S. overall.
College major statistics: distribution of doctoral degrees by discipline
| Academic year | Humanities | Psychology | Social sciences and history | Natural sciences and mathematics | Computer sciences | Engineering | Education | Business | Hea lth professions and rela ted programs | Other fields |
| 1970-71 | 6.8% | 3.3% | 5.6% | 14.0% | 0.2% | 5.7% | 9.3% | 1.2% | 22.6% | 31.3% |
| 1975-76 | 6.0% | 3.5% | 4.6% | 8.3% | 0.3% | 3.2% | 7.9% | 1.0% | 26.0% | 39.3% |
| 1980-81 | 4.9% | 3.6% | 3.2% | 7.6% | 0.3% | 2.7% | 7.4% | 0.8% | 28.2% | 41.3% |
| 1985-86 | 4.6% | 3.6% | 2.9% | 7.6% | 0.3% | 3.4% | 6.6% | 0.9% | 29.5% | 40.4% |
| 1990-91 | 4.6% | 3.7% | 2.9% | 8.9% | 0.6% | 5.0% | 5.9% | 1.1% | 26.3% | 41.0% |
| 1995-96 | 5.5% | 3.6% | 3.3% | 9.5% | 0.8% | 5.5% | 5.4% | 1.2% | 26.4% | 38.9% |
| 2000-01 | 5.4% | 4.3% | 3.3% | 8.5% | 0.6% | 4.6% | 5.3% | 1.0% | 30.7% | 36.3% |
| 2005-06 | 4.8% | 3.6% | 2.8% | 8.8% | 1.0% | 5.3% | 5.5% | 1.2% | 31.2% | 35.8% |
| 2010-11 | 5.1% | 3.6% | 2.7% | 8.9% | 1.0% | 5.1% | 5.9% | 1.4% | 35.1% | 31.3% |
| 2016-17 | 4.5% | 3.7% | 2.6% | 8.8% | 1.1% | 5.8% | 7.0% | 1.8% | 41.1% | 23.6% |
| 2017-18 | 4.5% | 3.4% | 2.5% | 8.9% | 1.1% | 6.0% | 7.0% | 1.8% | 41.7% | 23.0% |
| 2018-19 | 4.5% | 3.3% | 2.4% | 8.7% | 1.2% | 6.1% | 6.9% | 1.9% | 42.4% | 22.6% |
| 2019-20 | 4.4% | 3.3% | 2.3% | 8.4% | 1.3% | 5.9% | 6.9% | 1.8% | 43.4% | 22.4% |
| 2020-21 | 4.1% | 3.3% | 2.1% | 7.8% | 1.3% | 5.7% | 7.0% | 1.9% | 44.1% | 22.6% |
| 2021-22 | 4.2% | 3.3% | 2.2% | 8.5% | 1.4% | 6.0% | 7.3% | 2.2% | 43.0% | 21.9% |
Over the past five decades, doctoral education in the U.S. has undergone a structural transformation. Health professions have become the dominant field, driven by increasing demand for medical specialists and advanced healthcare researchers. In contrast, fields such as the humanities and social sciences have gradually declined, now accounting for less than 10% combined of all doctoral awards. Overall, these college major statistics underscore the evolution of doctoral education toward research, innovation, and practical application across professional domains.
After examining degree distributions by field of study, it’s important to look at how educational attainment has evolved overall, particularly the growing share of Americans earning master’s and advanced degrees.
How many Americans have a master’s or advanced degree?
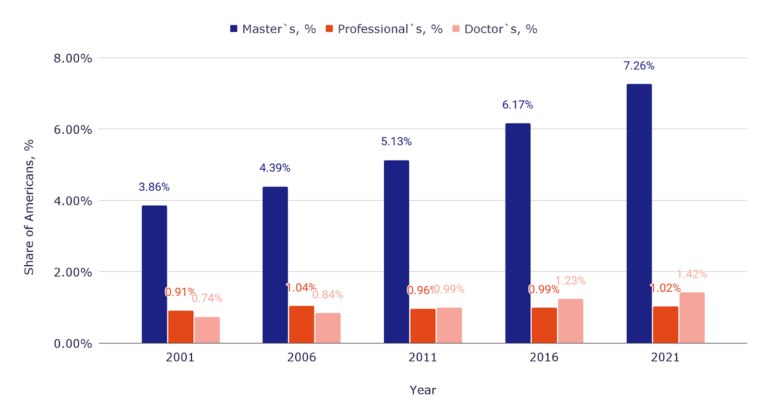
Over the past two decades, the percentage of Americans with a master’s degree has nearly doubled. In 2001, just 3.86% of the population held a master’s, but by 2021 this share had risen to 7.26%. Similar, though slower, growth occurred among holders of professional (1.02%) and doctoral degrees (1.42%).
- The percentage of Americans with a master’s degree increased from 3.86% in 2001 to 7.26% in 2021, showing almost a 90% increase in twenty years.
- The share of doctoral degree holders also grew, from 0.74% to 1.42%, reflecting a continued interest in the highest academic qualifications.
- Professional degrees, such as those in law or medicine, rose modestly, from 0.91% to 1.02%, indicating steady but slower growth compared to master’s programs.
Percentage of Americans with a master’s, professional, and doctoral degrees
| Year | Master`s, % | Professionals, % | Doctors’, % |
| 2001 | 3.86% | 0.91% | 0.74% |
| 2006 | 4.39% | 1.04% | 0.84% |
| 2011 | 5.13% | 0.96% | 0.99% |
| 2016 | 6.17% | 0.99% | 1.23% |
| 2021 | 7.26% | 1.02% | 1.42% |
Graduate education in the United States has become increasingly common, as more Americans pursue advanced qualifications to remain competitive in the labor market. The percentage of the population with a master’s degree continues to rise faster than any other advanced credential, highlighting the growing importance of specialized, postgraduate training. While doctoral and professional degrees have also expanded, the master’s remains the dominant form of advanced education in the U.S. These trends suggest that the number of people in the U.S. with a master’s degree will likely keep increasing in the coming years as employers demand higher levels of expertise and academic achievement.
After analyzing overall graduation and retention trends, it’s crucial to examine college graduation rates by race to understand disparities and progress among different demographic groups.
College graduation rates by race in the U.S.
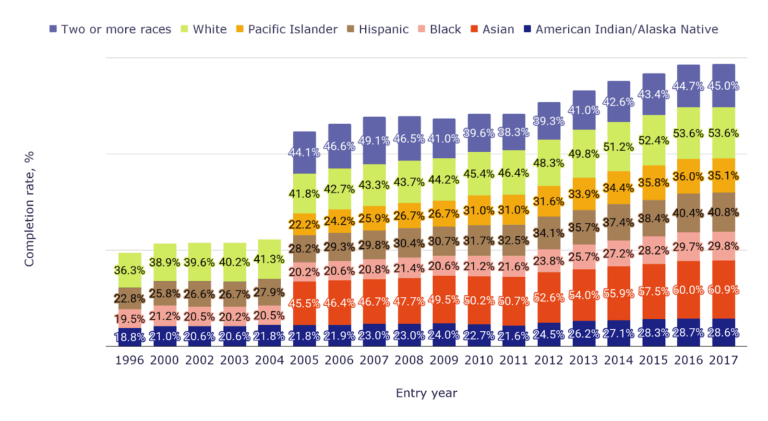
College completion in the United States varies widely across racial and ethnic groups. While overall college graduation rates have improved over the past two decades, gaps remain. For example, African American college graduation rates increased from 19.5% for the 1996 cohort to 29.8% for the 2017 cohort, whereas Asian students saw their graduation rates rise from 45.5% for the 2005 cohort to 60.9% for the 2017 cohort. These figures highlight ongoing disparities in educational attainment and persistence.
- Asian students have the highest college completion rates, increasing from 45.5% for the 2005 cohort to 60.9% for the 2017 cohort, far above the national average.
- African American students improved from 19.5% for the 1996 cohort to 29.8% for the 2017 cohort, reflecting gradual but persistent gains in college graduation rates by race.
How college completion differs across racial groups in the U.S.
| Entry year | American Indian/Alaska Native | Asian | Black | Hispanic | Pacific Islander | White | Two or more races |
| 1996 | 18.8% | 19.5% | 22.8% | 36.3% | |||
| 2000 | 21.0% | 21.2% | 25.8% | 38.9% | |||
| 2002 | 20.6% | 20.5% | 26.6% | 39.6% | |||
| 2003 | 20.6% | 20.2% | 26.7% | 40.2% | |||
| 2004 | 21.8% | 20.5% | 27.9% | 41.3% | |||
| 2005 | 21.8% | 45.5% | 20.2% | 28.2% | 22.2% | 41.8% | 44.1% |
| 2006 | 21.9% | 46.4% | 20.6% | 29.3% | 24.2% | 42.7% | 46.6% |
| 2007 | 23.0% | 46.7% | 20.8% | 29.8% | 25.9% | 43.3% | 49.1% |
| 2008 | 23.0% | 47.7% | 21.4% | 30.4% | 26.7% | 43.7% | 46.5% |
| 2009 | 24.0% | 49.5% | 20.6% | 30.7% | 26.7% | 44.2% | 41.0% |
| 2010 | 22.7% | 50.2% | 21.2% | 31.7% | 31.0% | 45.4% | 39.6% |
| 2011 | 21.6% | 50.7% | 21.6% | 32.5% | 31.0% | 46.4% | 38.3% |
| 2012 | 24.5% | 52.6% | 23.8% | 34.1% | 31.6% | 48.3% | 39.3% |
| 2013 | 26.2% | 54.0% | 25.7% | 35.7% | 33.9% | 49.8% | 41.0% |
| 2014 | 27.1% | 55.9% | 27.2% | 37.4% | 34.4% | 51.2% | 42.6% |
| 2015 | 28.3% | 57.5% | 28.2% | 38.4% | 35.8% | 52.4% | 43.4% |
| 2016 | 28.7% | 60.0% | 29.7% | 40.4% | 36.0% | 53.6% | 44.7% |
| 2017 | 28.6% | 60.9% | 29.8% | 40.8% | 35.1% | 53.6% | 45.0% |
The data reveal persistent disparities in college graduation rates by race and gender. While some groups, such as Asian students, achieve notably high completion rates, others (including African American, Hispanic, and Native American students) continue to graduate at lower rates. These differences are influenced by a combination of socioeconomic factors, access to resources, and institutional support.
Building on the racial disparities in college completion, it is also important to understand how educational attainment differs between male and female students.
College degrees by gender in the U.S.
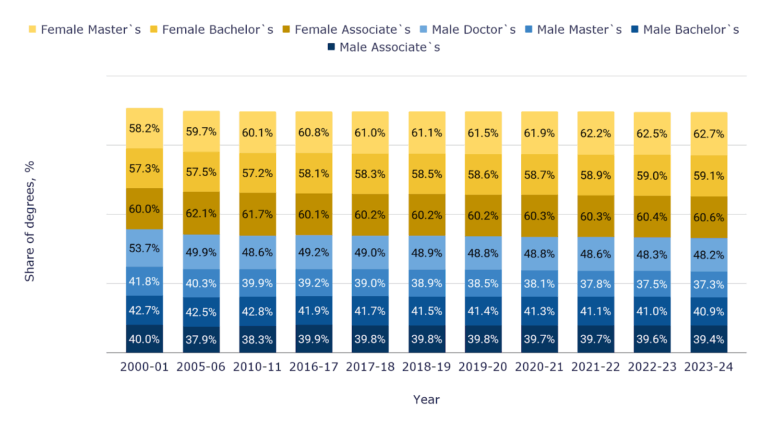
Over the past two decades, the gender distribution of U.S. college degrees has consistently favored women. While men represent less than 42% of degree earners across most levels, women have steadily expanded their share in every category from associate to master’s programs. This gender imbalance remains one of the most stable long-term patterns in American higher education.
- In the 2023-24 academic year, women earned 60.6% of associate’s, 59.1% of bachelor’s, and 62.7% of master’s degrees, while men accounted for the remaining shares.
- The gender gap in bachelor’s degrees has widened slightly, with female graduates increasing from 57.3% in 2000-01 to 59.1% in 2023-24.
- Only at the doctoral level do men remain relatively close, holding 48.2% of degrees in 2023-24, compared with 53.7% back in 2000-01.
How male and female students differ in college degrees
| Year | Male | Female | ||||||
| Associate`s | Bachelor`s | Master`s | Doctor`s | Associate`s | Bachelor`s | Master`s | Doctor`s | |
| 2000-01 | 40.0% | 42.7% | 41.8% | 53.7% | 60.0% | 57.3% | 58.2% | 46.3% |
| 2005-06 | 37.9% | 42.5% | 40.3% | 49.9% | 62.1% | 57.5% | 59.7% | 50.1% |
| 2010-11 | 38.3% | 42.8% | 39.9% | 48.6% | 61.7% | 57.2% | 60.1% | 51.4% |
| 2016-17 | 39.9% | 41.9% | 39.2% | 49.2% | 60.1% | 58.1% | 60.8% | 50.8% |
| 2017-18 | 39.8% | 41.7% | 39.0% | 49.0% | 60.2% | 58.3% | 61.0% | 51.0% |
| 2018-19 | 39.8% | 41.5% | 38.9% | 48.9% | 60.2% | 58.5% | 61.1% | 51.1% |
| 2019-20 | 39.8% | 41.4% | 38.5% | 48.8% | 60.2% | 58.6% | 61.5% | 51.2% |
| 2020-21 | 39.7% | 41.3% | 38.1% | 48.8% | 60.3% | 58.7% | 61.9% | 51.2% |
| 2021-22 | 39.7% | 41.1% | 37.8% | 48.6% | 60.3% | 58.9% | 62.2% | 51.4% |
| 2022-23 | 39.6% | 41.0% | 37.5% | 48.3% | 60.4% | 59.0% | 62.5% | 51.7% |
| 2023-24 | 39.4% | 40.9% | 37.3% | 48.2% | 60.6% | 59.1% | 62.7% | 51.8% |
Women have consistently outperformed men in earning college degrees for over two decades. The female majority is strongest at the associate’s and master’s levels, reflecting their growing participation in both entry-level and advanced academic programs. Although the gender gap is narrower at the doctoral level, the overall trend underscores women’s sustained dominance in higher education and the persistent underrepresentation of men across most degree types.
Conclusions
- U.S. college attainment has reached record highs, but access remains uneven. By 2025, over 4.7 million students graduate from American colleges each year, a milestone that underscores how far higher education has expanded in just two decades. Yet the gains are not evenly shared. The share of adults with a bachelor’s degree or higher stands at 36.4%, but this varies sharply by region: while Washington, D.C., leads with 65.5%, states like West Virginia and Mississippi remain below 30%, reflecting enduring geographic and socioeconomic divides.
- Graduation rates show steady improvement, though completion gaps persist. Nationally, the six-year graduation rate has increased from 55% in the mid-1990s to 64.6% for the 2016 cohort, and nearly half of students now complete a bachelor’s degree on time. Still, these averages hide stark disparities. Students from lower-income backgrounds and first-generation families are less likely to finish, while institutional differences in support, affordability, and academic readiness continue to shape outcomes.
- STEM and business majors dominate, signaling a shift toward career-driven education. The structure of U.S. higher education is changing. STEM fields now account for 21.6% of bachelor’s degrees, double their share in the 1970s, while business remains the single most popular major at 18.6%. In contrast, degrees in education and the humanities have steadily declined. This reflects a deeper economic trend: students increasingly choose programs with clear labor-market value, emphasizing practical skills and long-term employability over traditional academic disciplines.
- Advanced degrees are surging, redefining the meaning of higher education success. The share of Americans with a master’s degree has nearly doubled to 7.26% since 2001, marking the fastest growth among all academic credentials. As employers demand more specialized expertise, graduate education has become both a competitive advantage and, for many, a new baseline requirement. This expansion raises questions about affordability, student debt, and whether advanced degrees are delivering returns that justify their rising cost.
- Equity gaps remain the central challenge for U.S. higher education. Despite overall progress, racial and gender disparities persist. Asian students record the highest college completion rate at 60.9%, while Black students, though improving, remain below 30%. Women now graduate at consistently higher rates than men (59.1% versus 40.9% in bachelor’s degrees for 2023-24), continuing a long-term trend of gender imbalance in higher education. Addressing this gap is crucial not only for achieving gender equity but also for sustaining a skilled and inclusive workforce that mirrors the diversity of the United States.
Sources
- “2024, Educational Attainment, Annual: Bachelor’s Degree or Higher by State | FRED | St. Louis Fed.” Federal Reserve Bank of St. Louis, https://fred.stlouisfed.org/release/tables?eid=391444&rid=330. Accessed 06 October 2025.
- Associate’s Degrees Conferred by Postsecondary Institutions, by Race/Ethnicity and Sex of Student: Selected Academic Years, 1976-77 through 2021-22. https://nces.ed.gov/programs/digest/d23/tables/dt23_321.20.asp. Accessed 06 October 2025.
- Bureau, US. “A Higher Degree.” Census.Gov, 24 Feb. 2022, https://www.census.gov/library/visualizations/2022/comm/a-higher-degree.html. Accessed 06 October 2025.
- Graduation Rate from First Institution Attended for First-Time, Full-Time Bachelor’s Degree-Seeking Students at 4-Year Postsecondary Institutions, by Race/Ethnicity, Time to Completion, Sex, Control of Institution, and Percentage of Applications Accepted: Selected Cohort Entry Years, 1996 through 2017. https://nces.ed.gov/programs/digest/d24/tables/dt24_326.10.asp. Accessed 06 October 2025.
- https://nces.ed.gov/programs/digest/d24/tables/dt24_326.10.asp. Accessed 06 October 2025.
- Number and Percentage Distribution of Bachelor’s, Master’s, and Doctor’s Degrees Conferred by Postsecondary Institutions, by Field of Study: Selected Academic Years, 1970-71 through 2021-22. https://nces.ed.gov/programs/digest/d23/tables/dt23_318.20.asp. Accessed 06 October 2025.
- https://nces.ed.gov/programs/digest/d23/tables/dt23_318.20.asp. Accessed 06 October 2025.
- Number and Percentage Distribution of Science, Technology, Engineering, and Mathematics (STEM) Degrees/Certificates Conferred by Postsecondary Institutions, by Race/Ethnicity, Level of Degree/Certificate, and Sex of Student: Academic Years 2012-13 through 2022-23. https://nces.ed.gov/programs/digest/d24/tables/dt24_318.45.asp. Accessed 06 October 2025.
- Number of Degrees/Certificates Conferred by Postsecondary Institutions, by Control of Institution and Level of Degree/Certificate: Academic Years 1970-71 through 2022-23. https://nces.ed.gov/programs/digest/d24/tables/dt24_318.40.asp. Accessed 06 October 2025.
- Percentage Distribution of First-Time, Full-Time Bachelor’s Degree-Seeking Students at 4-Year Postsecondary Institutions 6 Years after Entry, by Completion and Enrollment Status at First Institution Attended, Sex, Race/Ethnicity, Control of Institution, and Percentage of Applications Accepted: Cohort Entry Years 2011 and 2016. https://nces.ed.gov/programs/digest/d23/tables/dt23_326.15.asp. Accessed 06 October 2025.
- Retention of First-Time Degree-Seeking Undergraduates at Degree-Granting Postsecondary Institutions, by Attendance Status, Level and Control of Institution, and Percentage of Applications Accepted: Selected Years, 2012 through 2023. https://nces.ed.gov/programs/digest/d24/tables/dt24_326.30.asp. Accessed 06 October 2025.
- Degrees Conferred by Degree-Granting Postsecondary Institutions, by Level of Degree and Sex of Student: Selected Years, 1869-70 through 2023-24. https://nces.ed.gov/programs/digest/d13/tables/dt13_318.10.asp?utm_source=chatgpt.com. Accessed 06 October 2025.
- https://nscresearchcenter.org/wp-content/uploads/Completions_Report_2023.pdf. Accessed 06 October 2025.

