Infographics or informational graphics are one of the most convenient visual tools to present your data laconically. Cool infographics are widely used in social media marketing and presentations. Why not use them in studies? They will help not only to present a lot of information in one slide but also to impress your instructor and your classmates.
Table of contents
What is an infographic?
An infographic is a visual representation of information that helps to simplify the understanding and memorizing of statistical, digital, and other kinds of data. If you’re looking for engaging content to visualize, our list of controversial topics to talk about can offer compelling ideas worth exploring.
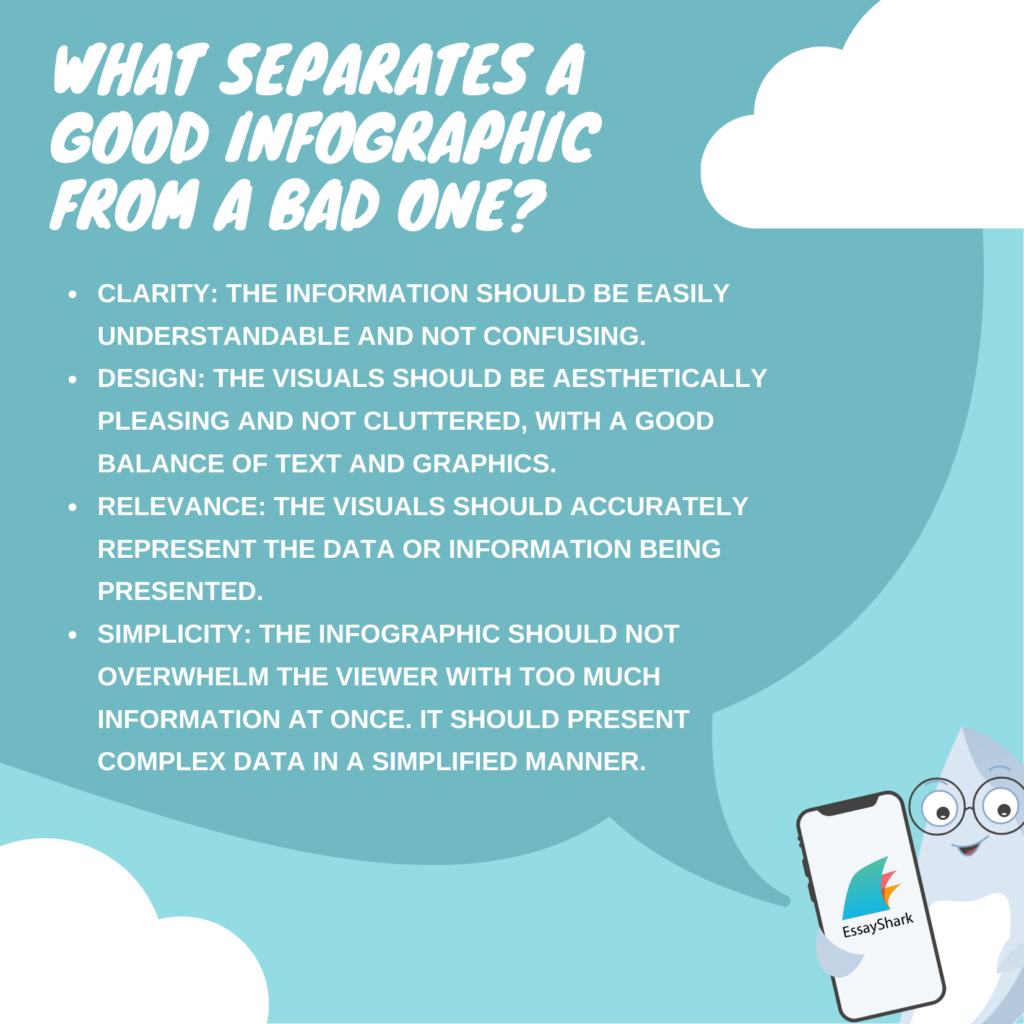
The main features of a good infographic are:
- bright contrasting colors
- laconic manner (no long sentences)
- a well-balanced mix of numbers and words
- readable fonts
- clear presentation
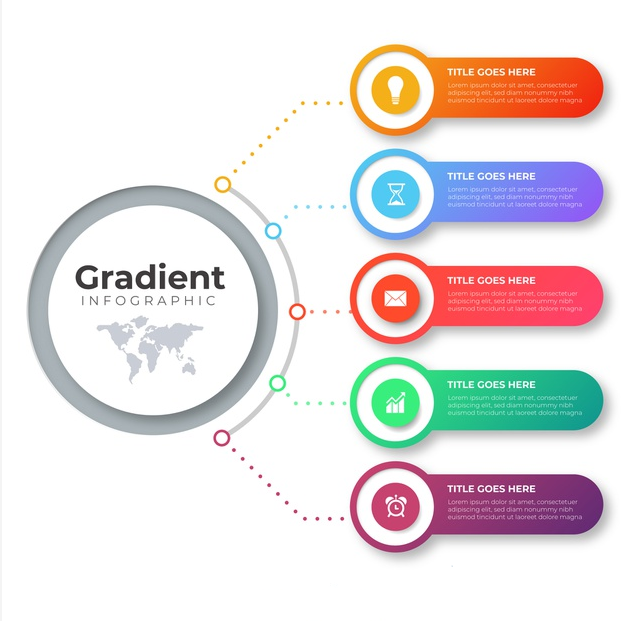
We want to present a few examples so that you know what a good infographic looks like:


How to make cool infographics?
How to make infographics to turn boring data into fascinating visualizations? It’s not that difficult: follow our step-by-step guide, and you’ll succeed!
Step 1
Set a particular aim to follow. Make sure the information you are going to speak about can be presented in several phrases, numbers, and pictures and will get the audience interested.
Step 2
Choose relevant and unusual facts to make cool infographics. For example, the digital technology experiments of Finnish teachers, the strange traditions of students in the best colleges for criminal justice, the meaning of social media in science, India’s recent space mission, the disease and death rates of vegetarians, and many others.
Step 3
Check chosen facts attentively before including them in your infographic. Be skeptical about the resources. Choose reputable “.edu” domains and other tried and tested sites.
Step 4
Make it short. Use as little text as possible. It should only emphasize particular facts, but nothing more. The main parts of an infographic are the images, graphs, lists, scales, etc.
Step 5
Choose online services to do infographics. You don’t have to be Picasso to create stylish infographics. We’ll share a few links where you’ll find easy-to-use services.
Step 6
Look through your infographic attentively. Make sure you’ve presented all the information you needed in a simple and collaborative way and that its facts are logically connected with each other. It should be visually awesome and look impressive to the audience.
Step 7
Introduce sources you’ve used while preparing your infographic. Firstly, don’t forget about copyright laws – you can’t steal someone else’s infographic and present it as your own. Secondly, a list of reliable sources will make your infographic more persuasive.
Step 8
Write a speech if needed. If you’re going to present your report or research in front of an audience, a nice picture isn’t enough. You’ll have to impress them with your public speaking skills as well. In case you have difficulties with speech writing, the EssayShark team is always ready to assist and create a well-structured speech sample for you.
How to make an infographic online
Infographics can be a practical format for reports, reviews, lab results, presentations, and other assignments that require careful research but have strict word limits. They help organize key points visually, making complex information easier to understand and compare. Using visual elements alongside text can also improve clarity and reader engagement. Many students combine infographics with free writing tools to plan content, structure their ideas, and check accuracy before turning their findings into a visual summary. This approach often makes the workflow more efficient while still supporting solid academic research and clear communication.
There are dozens of free services for you that turn the process of making an infographic into a funny game. With their easy and user-friendly templates, you will manage to create an impressive presentation, comparison, analysis, review, or any other type of assignment within several hours or less.
It’s a free slide maker that will help you to make visuals in minutes. This service is totally free: you only have to register. In addition, Canva also helps to create impressive social media posts, letters, collages, planners, fliers, and other samples.
On this website, you can find thousands of infographic templates for your works. Some of them are free to download and use, and others require a premium subscription. A subscription for one month will cost you 9.99 EUR.
Another helpful service from Adobe Inc. allows internet users to create impressive infographics even if they have no design skills at all. We also recommend checking their blog and gallery for inspiration and amazing ideas for your works.
This service is free for students, but you’ll have only five infographics per month. However, we recommend you to take a shot.

Create a clear and engaging infographic that explains your topic in a visually structured way. Focus on key facts, short explanations, and readable data blocks so viewers can quickly understand the message. If you run into difficulties with the writing or structuring process, you can look for guidance and examples on platforms such as essayshark.com. You may also find it useful to work with practical writing tools like word-to-page converters, paraphrasing tools, and GPA calculators to organize and refine your material more efficiently.


